
Image
|
Figure Caption
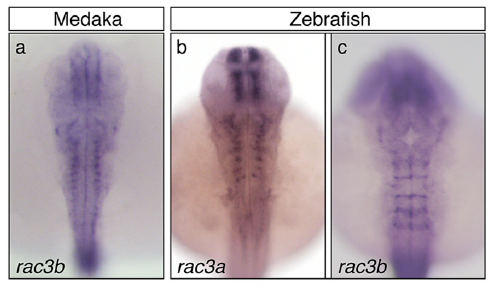
Fig. S3
Comparison of the hindbrain expression profiles of rac3a and rac3b paralog genes from medaka and zebrafish. In situ hybridization of medaka (A; stage 24) and zebrafish (B; 40 hpf; C; 24 hpf) embryos for rac3a (B) and rac3b (A and C) genes. Note that rac3b in medaka is not expressed in hindbrain boundaries, and its expression is similar to rac3a in zebrafish. All images are dorsal views with anterior at the top.
Figure Data
Acknowledgments
This image is the copyrighted work of the attributed author or publisher, and
ZFIN has permission only to display this image to its users.
Additional permissions should be obtained from the applicable author or publisher of the image.
Full text @ Proc. Natl. Acad. Sci. USA