
|
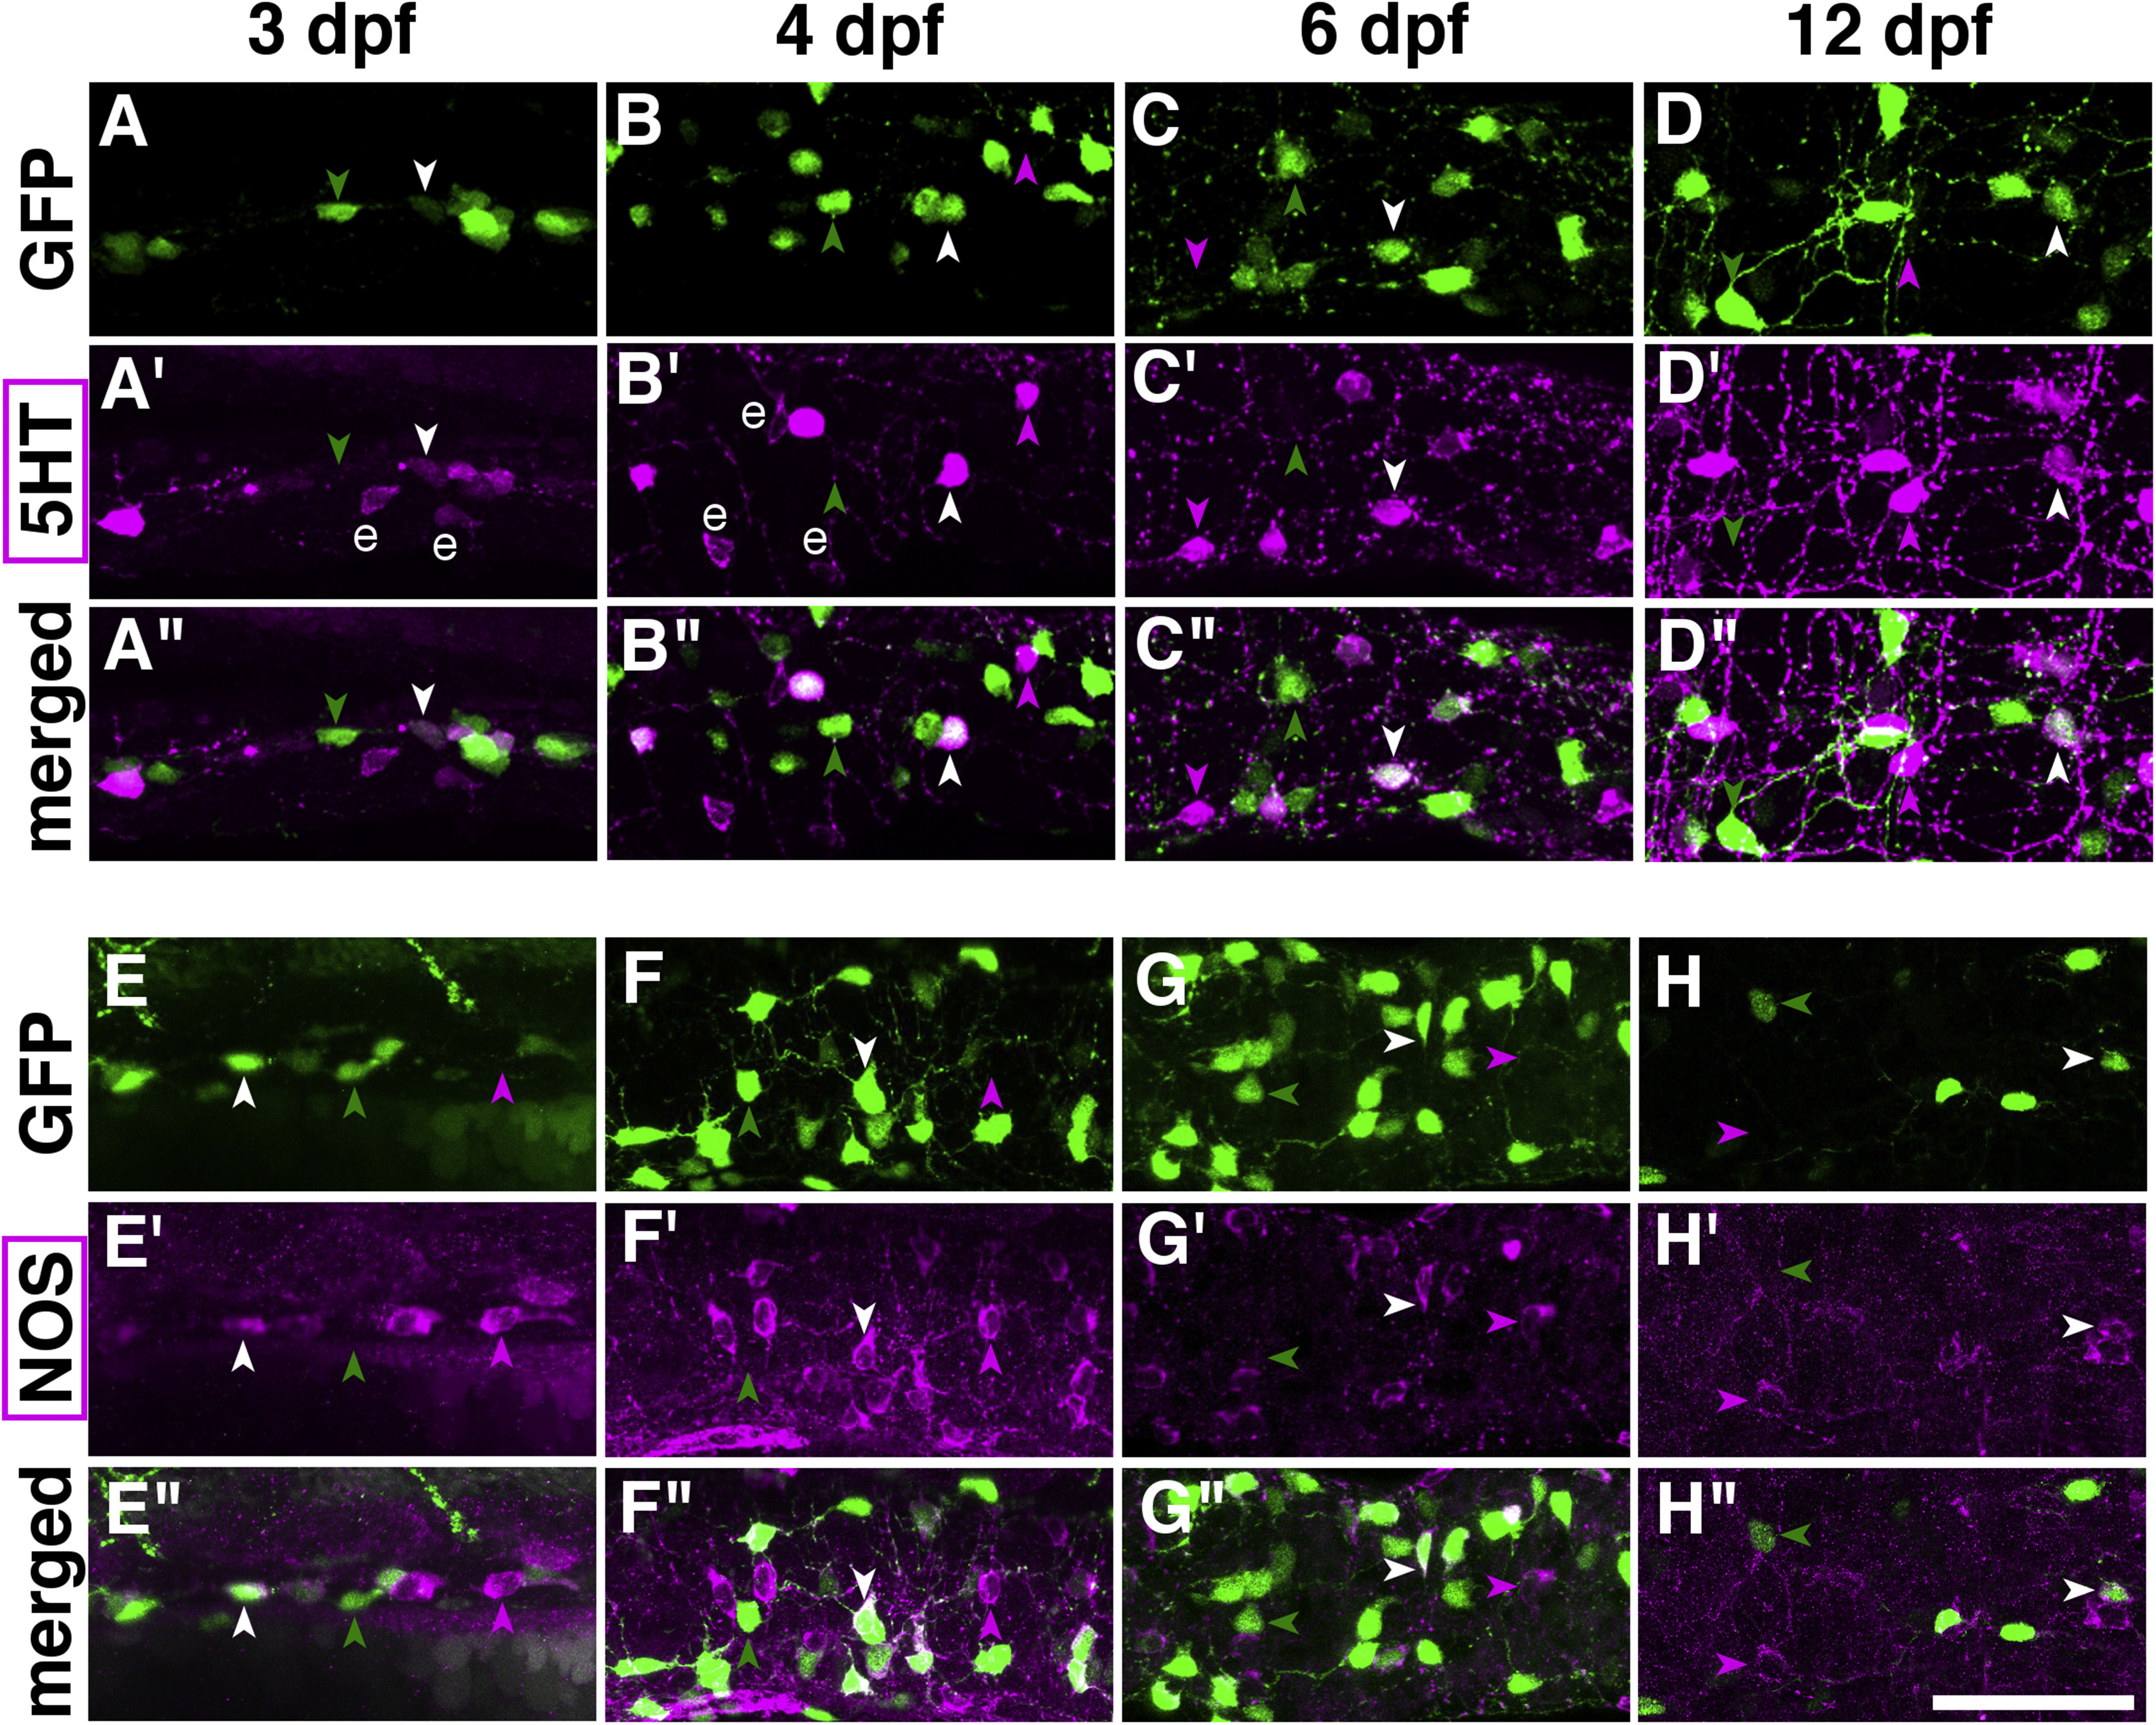
Fig. 5
Immunostaining of 5-HT or Nos1 with GFP in the gut of Tg(chata:GGFF2) larvae. Some of the GFP + cells expressed either 5-HT or Nos1. Double staining of GFP and 5-HT (A–D) or, GFP and Nos1 (E–H) is shown. The expression patterns of GFP (A–D), 5-HT (A′–D′) and merged images (A″–D″) at 3 dpf (A), 4 dpf (B), 6 dpf (C) and 12 dpf (D) are shown. Green arrowheads: GFP + cells. Magenta arrowheads: 5-HT + cells. White arrowheads: GFP/5-HT double + cells. Anterior, to the left. The cells marked with 'e' in panels A′ and B′ are enterochromaffin cells. The data for Nos1 are presented as for 5-HT. The ratio of 5-HT+/GFP + cells in the GFP + cells and the ratio of Nos1+/GFP + cells in the GFP + cells did not change during the 3-dpf to 12-dpf stages and were 22%–32% for 5-HT and 37%–53% for Nos1. See the text for the details. Scale bar: 50 μm.
Reprinted from Gene expression patterns : GEP, 28, Nikaido, M., Izumi, S., Ohnuki, H., Takigawa, Y., Yamasu, K., Hatta, K., Early development of the enteric nervous system visualized by using a new transgenic zebrafish line harboring a regulatory region for choline acetyltransferase a (chata) gene, 12-21, Copyright (2018) with permission from Elsevier. Full text @ Gene Expr. Patterns