
|
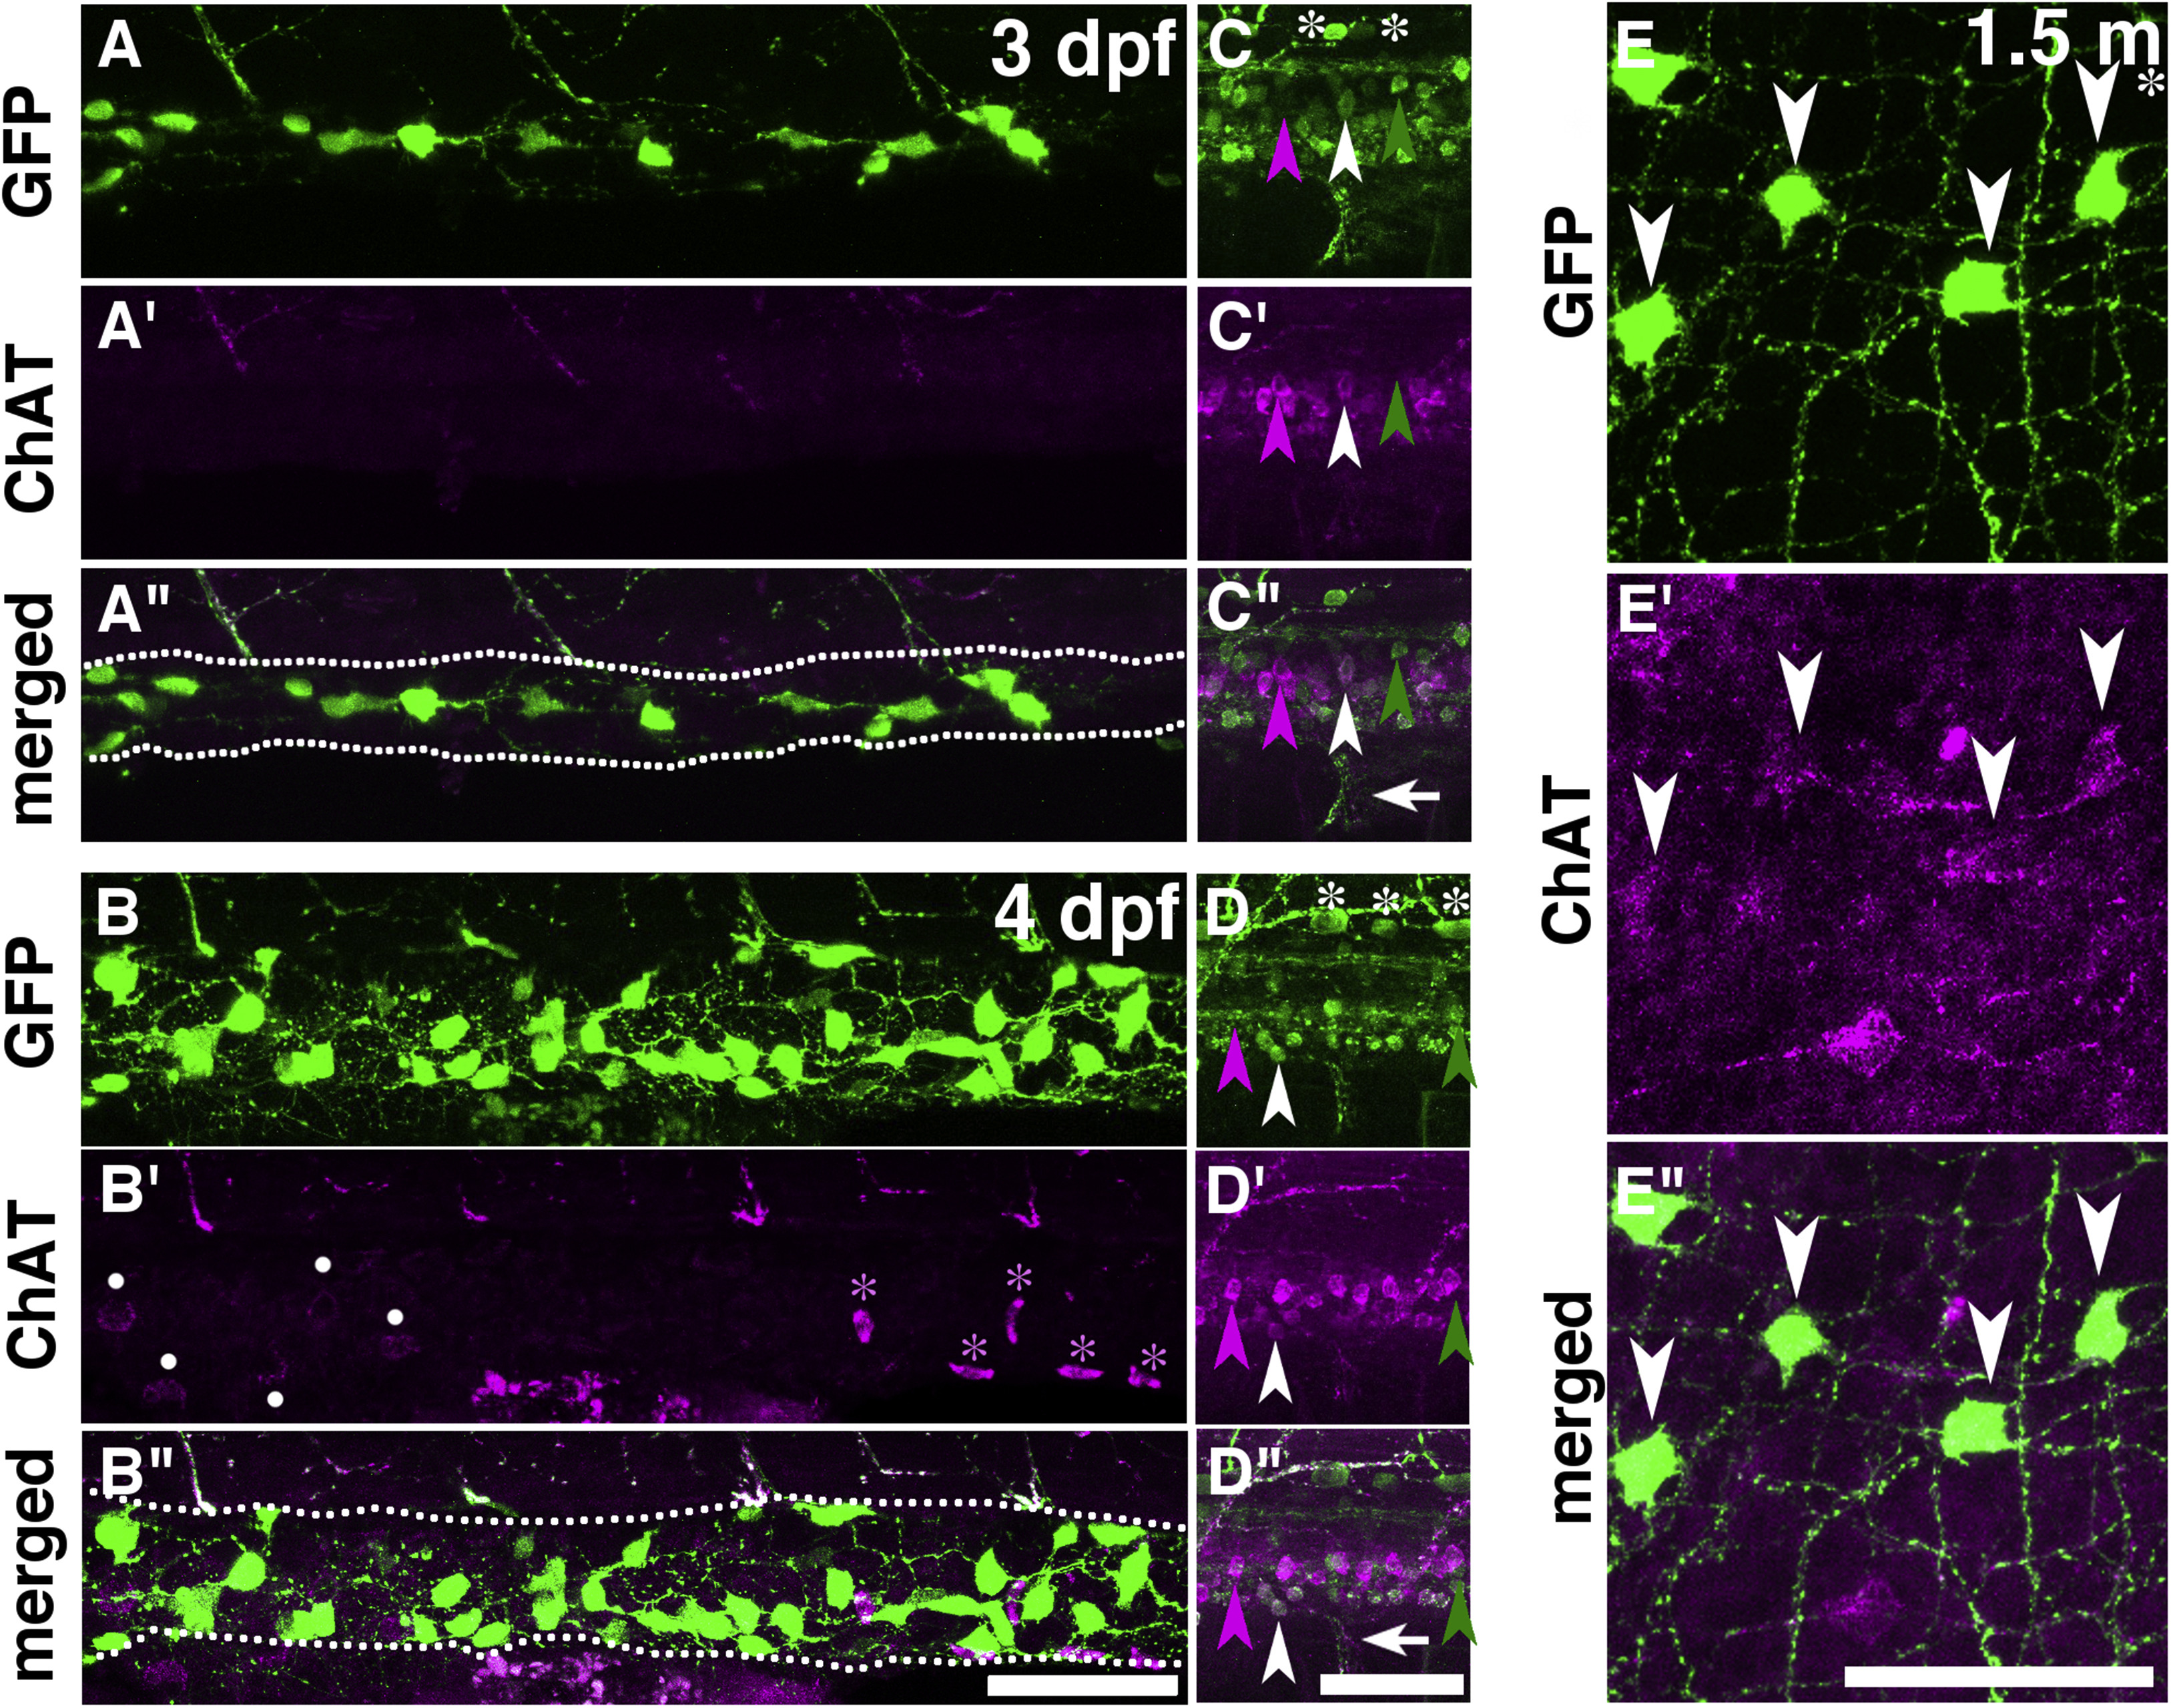
Fig. 4
Immunostaining of ChAT and GFP in the gut and CNS of Tg(chata:GGFF2) larvae and young adults. The expression patterns of GFP (A–E), ChAT (A′–E′) and merged images (A″–E″) in 3-dpf (A,C), 4-dpf (B,D) and 1.5-month-old (E) fish are shown. In the gut of 1.5-month old fish (E), 66% of GFP + cells were ChAT+, whereas ChAT immunostaining was not detected in the guts at 3 and 4 dpf (A,B). The expressions of GFP (green arrowheads), ChAT (magenta arrowheads), and both GFP and ChAT (white arrowheads) are shown. Some cells expressed only ChAT or GFP. White asterisks: Rohon-Beard neurons. White arrows: Motor axons expressing GFP and ChAT. White dots: Unknown cells outside of the gut. Magenta asterisks: Blood cells. Anterior, to the left. Dorsal, to the top for 3- and 4-dpf embryos. Dotted lines in A″ and B″ are outlines of gut. Scale bars: 50 μm.
Reprinted from Gene expression patterns : GEP, 28, Nikaido, M., Izumi, S., Ohnuki, H., Takigawa, Y., Yamasu, K., Hatta, K., Early development of the enteric nervous system visualized by using a new transgenic zebrafish line harboring a regulatory region for choline acetyltransferase a (chata) gene, 12-21, Copyright (2018) with permission from Elsevier. Full text @ Gene Expr. Patterns