
|
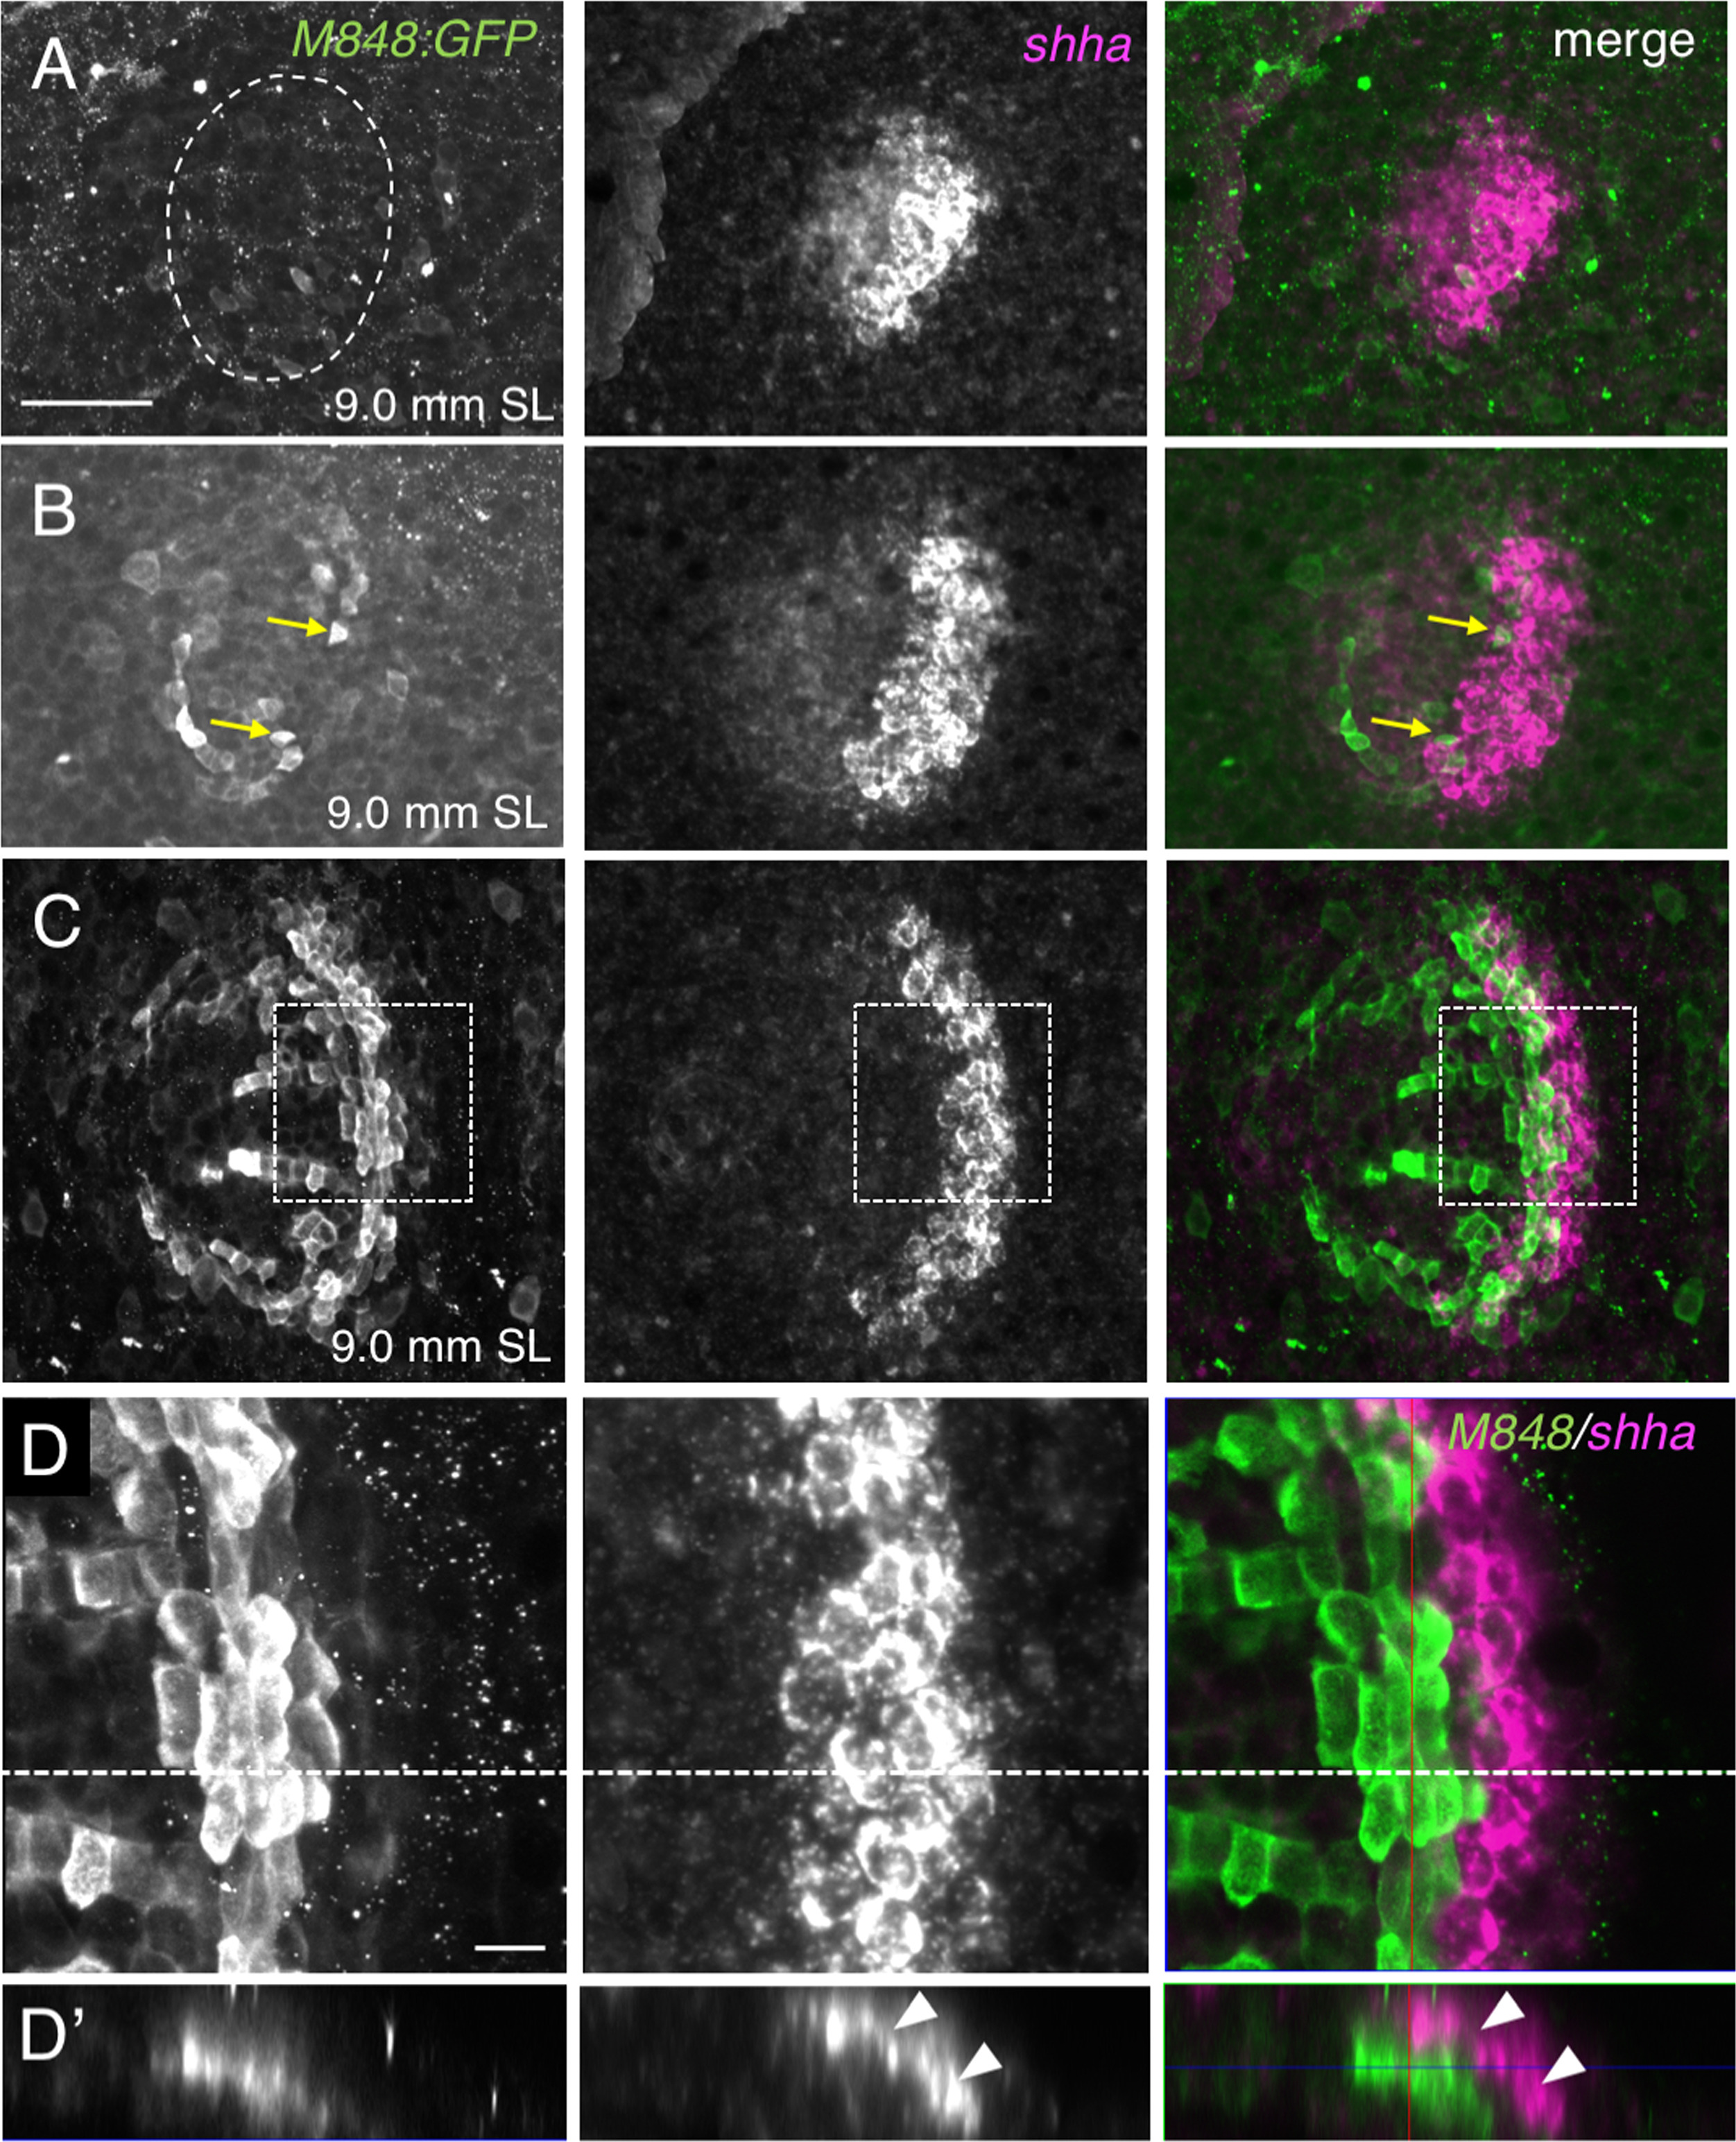
Fig. 6
Expression of shha in the epidermal cells overlying marginal osteoblasts. (A–D) M848:GFP juvenile fish were double stained with anti-GFP antibody (green) and anti-sense shha RNA probe (magenta). A prospective scale area is indicated by the dotted line in (A). The expression domain of shha becomes restricted to the posterior part of the scale when M848:GFP is expressed (B,C). Arrows in (B) indicate GFP-expressing cells. (D) Higher magnification image of the area shown in (C). (D′) Optical cross-section along the dashed line in (D) at a thickness of 21.1 µm. shha is expressed in arrays of cells adjacently overlying the marginal cells (arrowheads). Scale bars, 50 µm (A–C), 10 µm (D).
Reprinted from Developmental Biology, 437(2), Iwasaki, M., Kuroda, J., Kawakami, K., Wada, H., Epidermal regulation of bone morphogenesis through the development and regeneration of osteoblasts in the zebrafish scale, 105-119, Copyright (2018) with permission from Elsevier. Full text @ Dev. Biol.