
|
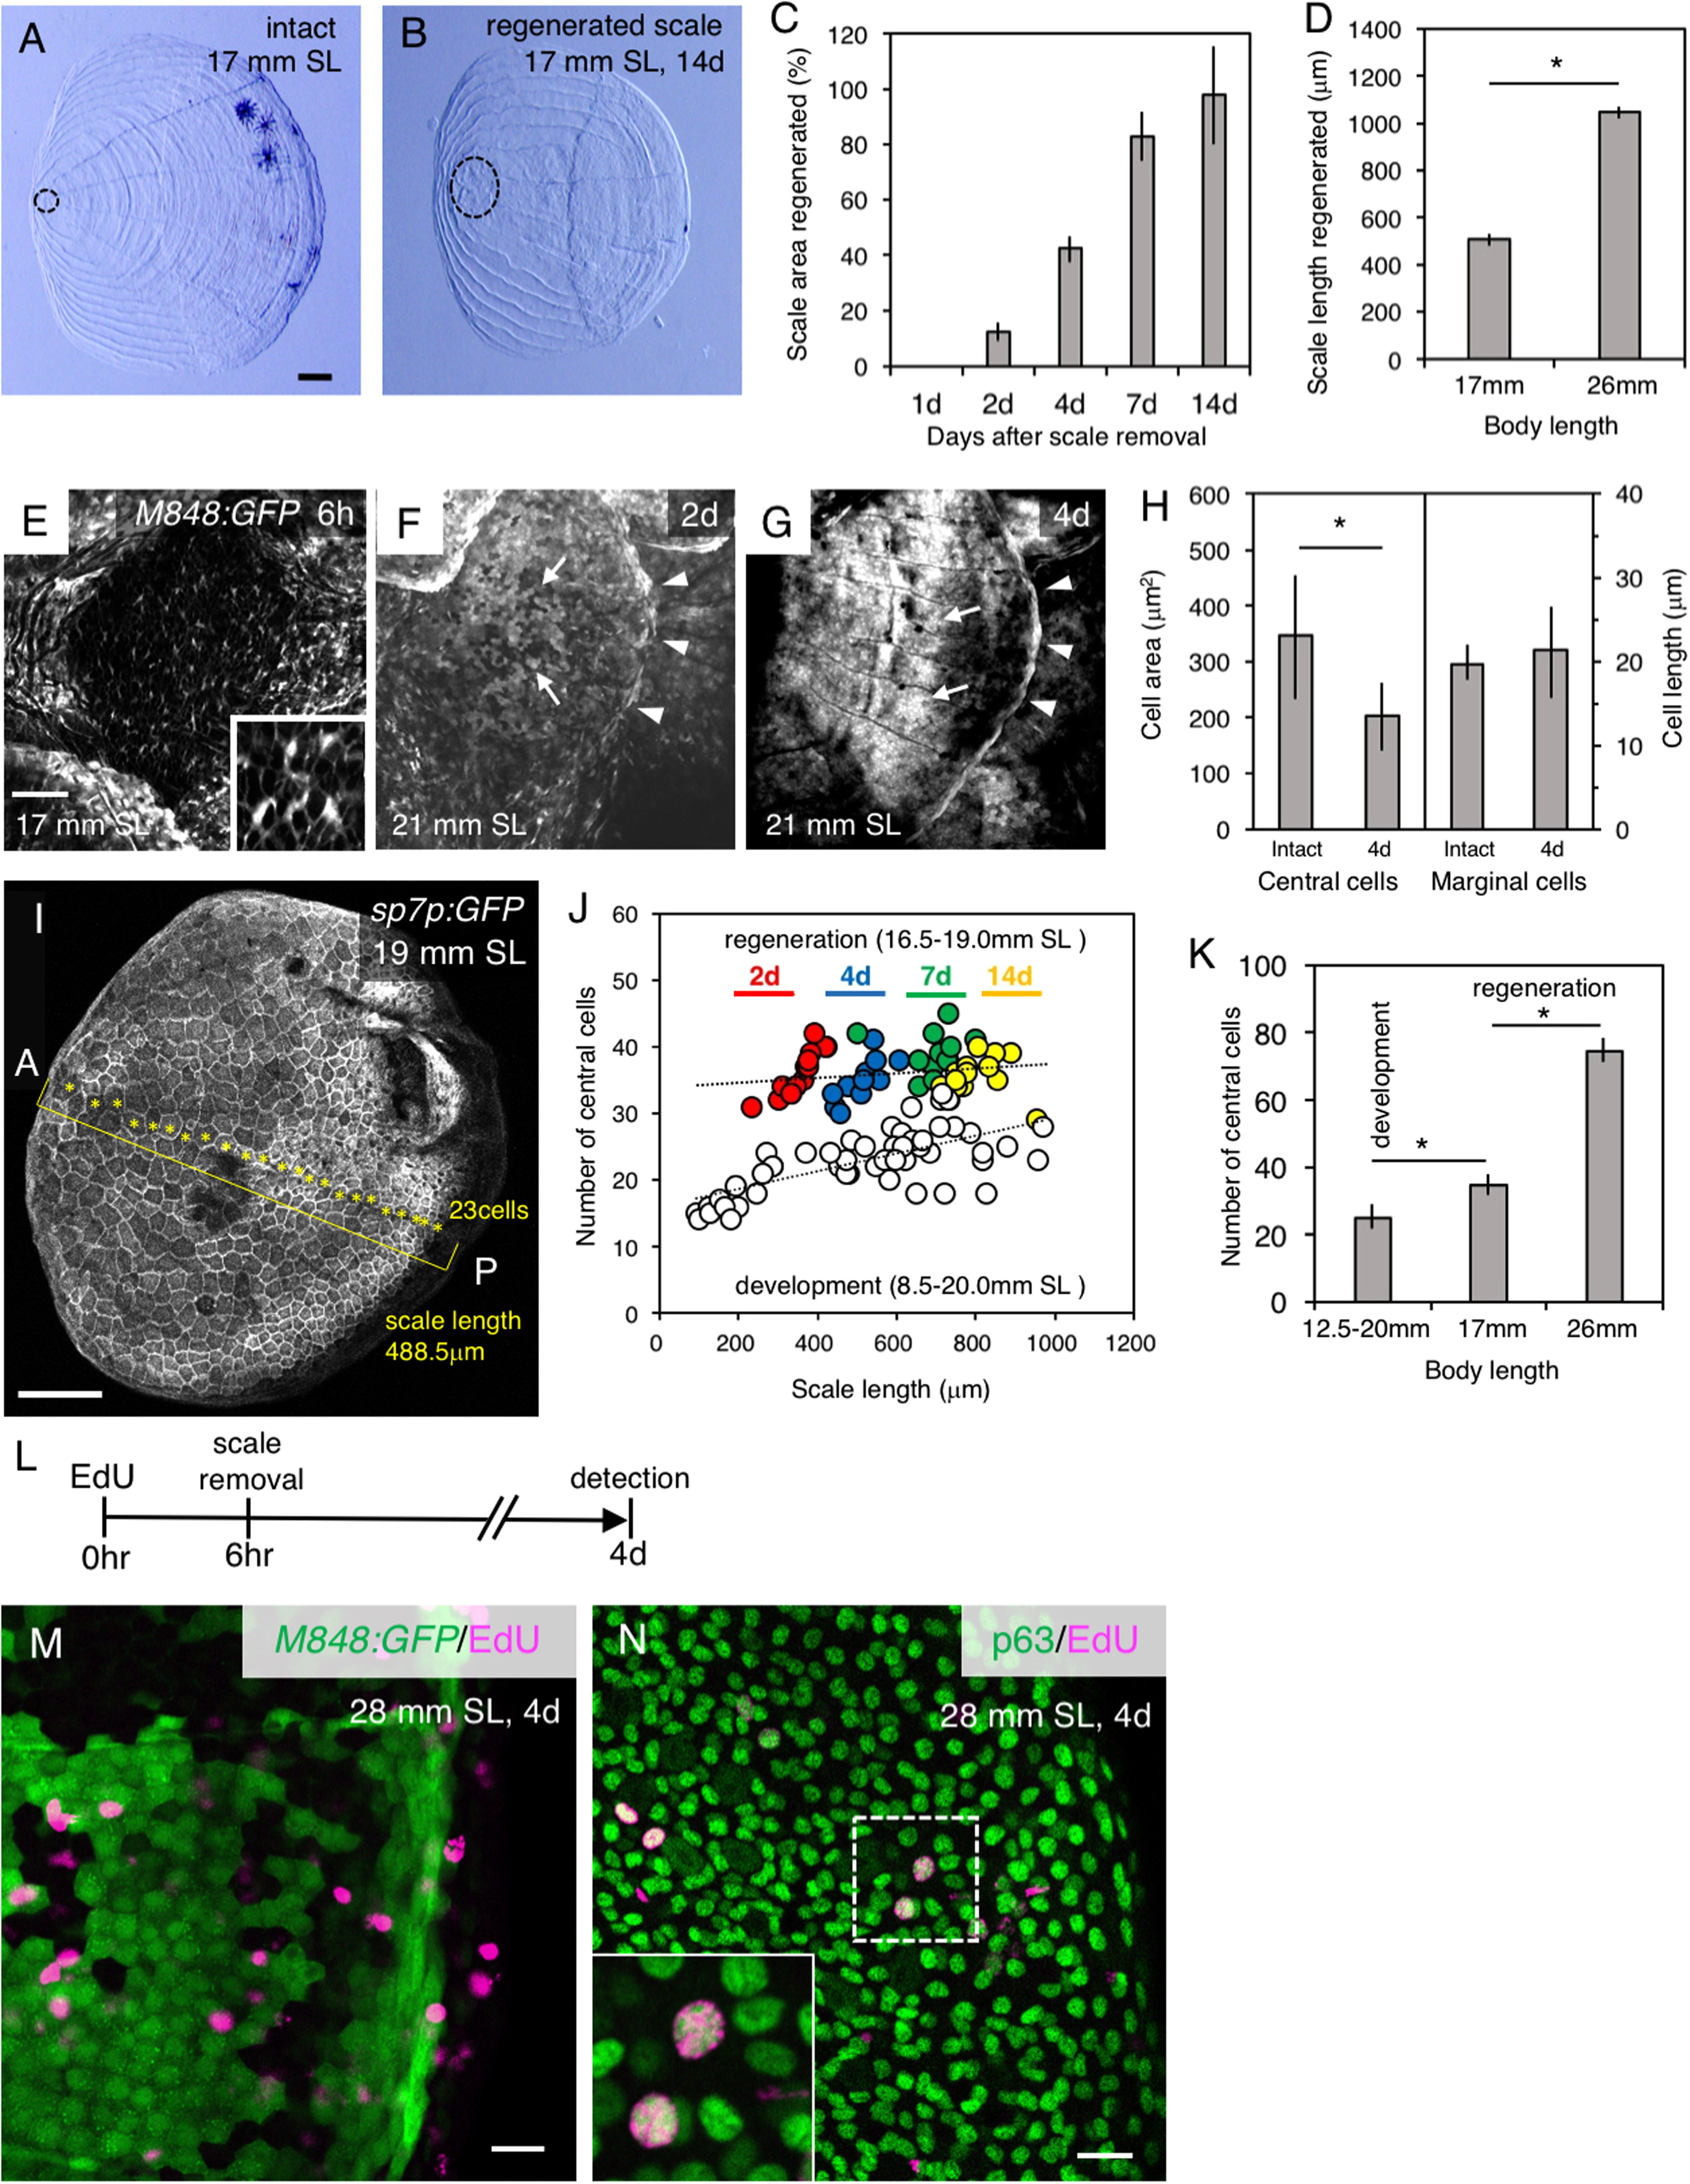
Fig. 4
Different cell dynamics between the scale development and regeneration processes. (A,B) Comparison of an intact scale (A) with a regenerated scale 14 days after removal (B). The focus area is indicated by the dotted lines. (C) Recovery of the area of regenerated scales after scale removal. (D) Scale regeneration at 4 days after scale removal is faster in a larger than smaller fish. (E–G) Regeneration of scales in the M848:GFP fish 6 h (E), 2 days (F), and 4 days (G) after scale removal. Mesenchymal-like cells are observed after scale removal along the dermis (E; Inset, higher magnification). Central (arrows) and marginal (arrowheads) cells are distinguishable at 2 (F) and 4 days (G). (H) The central cells in regenerated scales are significantly smaller than in normal scales of a similar size (438–606 µm). In contrast, the size and shape of marginal cells are the same in developing and regenerating scales. (I) Counting of the number of sp7p:GFP-caax-expressing cells located along the horizontal line of a scale: in this image, 23 cells are observed (asterisks). (J) There are differences in the number of central cells between the development (open circle) and regeneration (solid circle; colors represent days after scale removal) processes. The number of central cells increases gradually during scale growth. (K) Correlation between the total number of central cells in a regenerated scale and body size. (L) Overview of the EdU incorporation experiment. EdU was injected 6 h before scale removal, and detected after 4 days. (M) EdU is not incorporated into the M848:GFP-expressing cells. (N) A significant proportion of proliferating cells along the regenerating scale are anti-p63-immunoreactive epidermal cells. Data are given as the mean± s.d. (C,D,H,K) *P < 0.05 (t-test). Scale bars, 100 µm (A,B,E–G, I), 20 µm (M,N).
Reprinted from Developmental Biology, 437(2), Iwasaki, M., Kuroda, J., Kawakami, K., Wada, H., Epidermal regulation of bone morphogenesis through the development and regeneration of osteoblasts in the zebrafish scale, 105-119, Copyright (2018) with permission from Elsevier. Full text @ Dev. Biol.