
|
Fig. S5
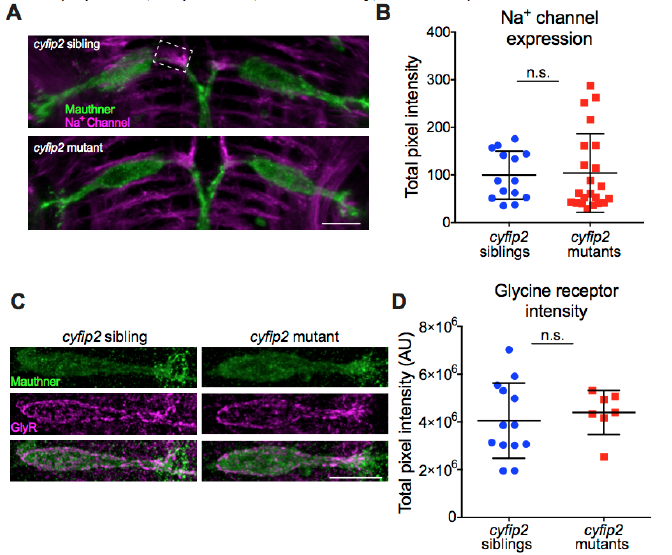
Sodium channel and Glycine receptor expression on the Mauthner cell is normal in cyfip2 mutants, Related to Figure 3 (A) Representative images of maximum intensity projections of confocal stacks showing Mcell membranes (green), labeled by Tg(GFFDMC130a);Tg(UAS:gap43-citrine) and α- GFP Ab and sodium channels (Na+ channel, magenta), labeled by a pan-Na+ channel Ab (scale bar: 10 μm). Dashed box indicates the area of the Mcell axon cap that was analyzed in (B). (B) Quantification of Na+ channel expression in the Mcell axon cap (n=14 siblings, 22 mutants; p=0.62, Mann-Whitney; mean ± SD). (C) Representative examples of cyfip2 sibling and mutant Mcell glycine receptor (GlyR) expression. GlyR were labeled with an α-GlyR Ab (magenta) (scale bar: 10 μm). (D) Total intensity of GlyR staining on the Mcell was unchanged in cyfip2 mutants (n=13 sibling larvae, 7 mutant larvae; p=0.59, Mann-Whitney; mean ± SD).