
|
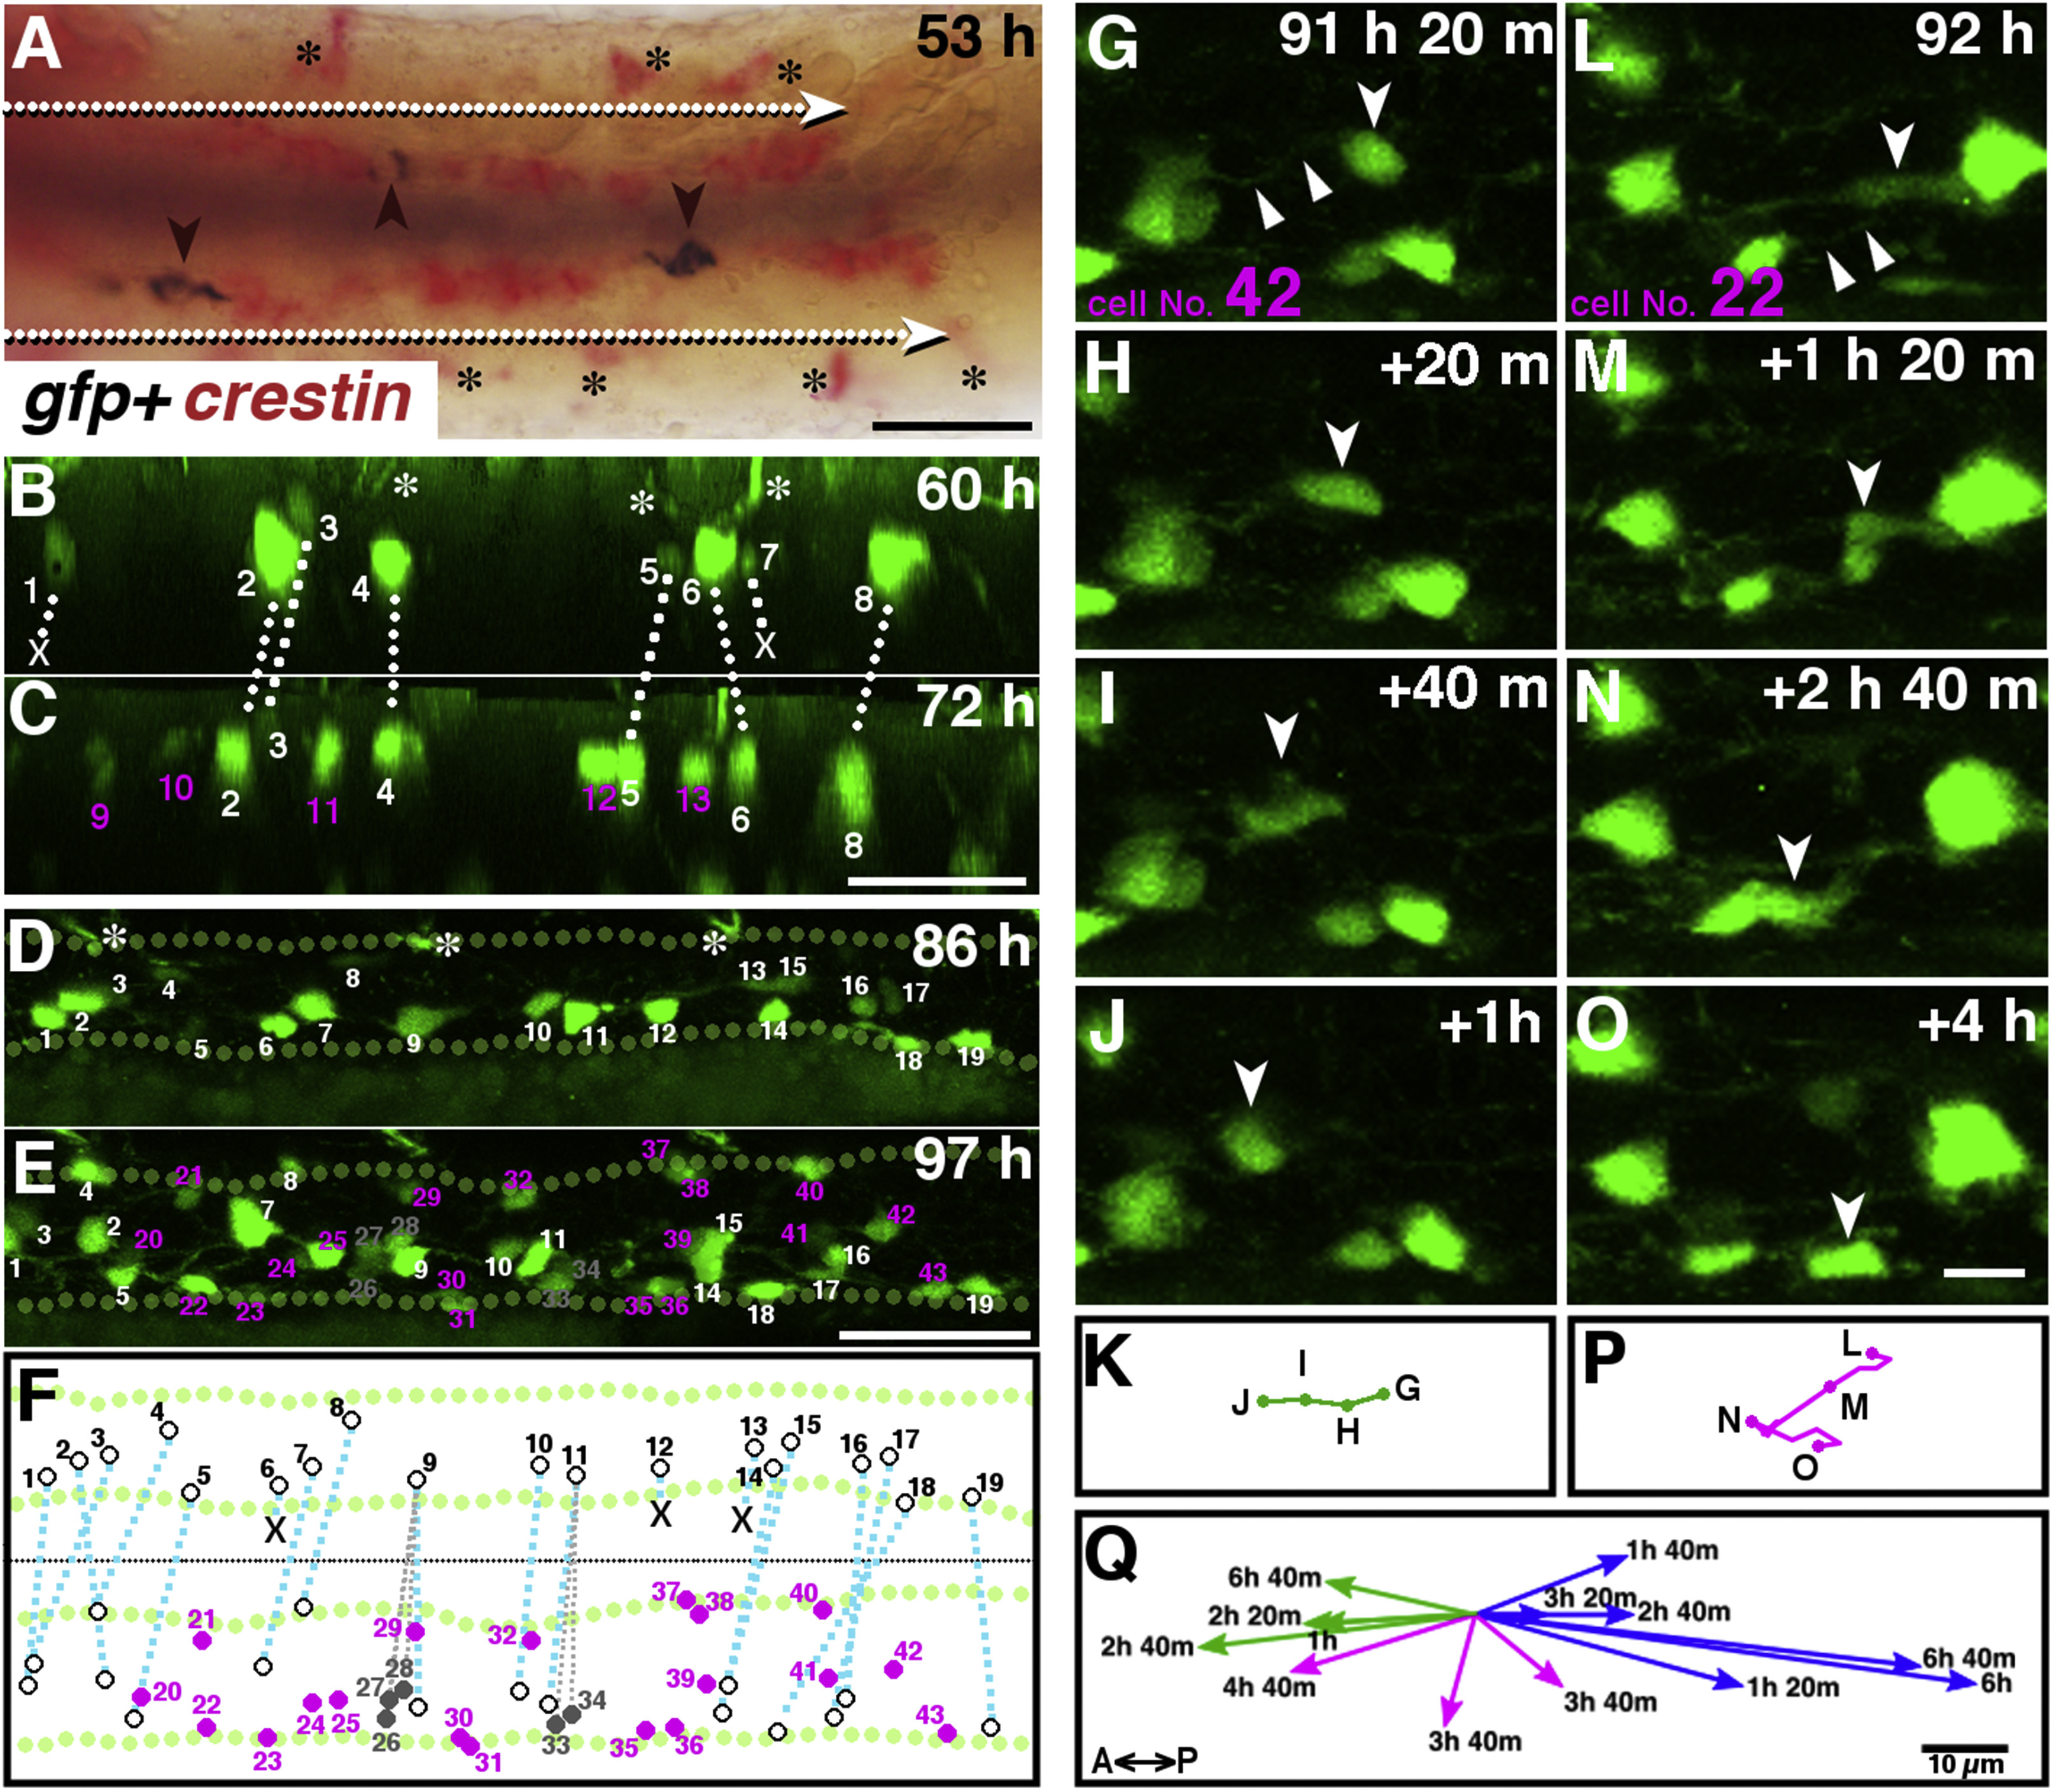
Fig. 6
Time-lapse imaging analysis of GFP + cells in the gut of Tg(chata:GGFF2). A: A double in situ image of crestin and gfp at 53 hpf. Red signals of crestin reveal the enteric neural crest cells that migrate from anterior to posterior as a pair of rows of cells (white arrows). Spotty gfp signals (brown signals indicated by arrowheads) are located among the neural crest cells. The black asterisks indicate crestin + cells outside of the gut, which may be precursors of pigment cells. Ventral view. Anterior, to the left. Scale bar: 50 μm. B–F: Live imaging of Tg(chata:GGFF2). Snapshots of Suppl. Movie S1 at 60 hpf (B) and 72 hpf (C) and Suppl. Movie S3 at 86 hpf (D) and 97 hpf (E). GFP + cells that were already present at the beginning of the movie are marked by white numbers, and newly appeared GFP + cells in the movie are marked by magenta numbers. Cell Nos. 1 and 7 in panel B disappeared during observation (marked by white Xs). Cell Nos. 26–28 and Nos. 33 and 34 (gray numbers) were undistinguishable from No. 9 and No. 11 at the first time point, respectively. Brightest cells are marked with No. 9 and 11 at the last time point, and others are labeled with Nos. 26–28 and Nos. 33, 34 in gray. The white asterisks in panels B and D mark GFP + neurites from outside of the gut. Green dotted lines in panels D and E outline the guts. Ventral views for panels B and C, left-side views for panels D and E, with anterior to the left. F: A schematic drawing showing the correspondence of all GFP + cells in panels D and E. The GFP + cells from the beginning are connected with blue-dotted lines, newly appeared GFP + cells are in magenta, and the GFP + cells that were undistinguishable with No.9 and 11 described above are in gray. Scale bars: 50 μm. G–Q: Serial photos of migrating cell No. 42, moving anteriorly (G–J) and No. 22, moving in a zig-zag manner (L–O) taken at indicated time points. The white arrowheads point to the migrating cells of interest. The white triangles in panels G and L indicate the GFP + processes along which the cells migrated. Panels (K) and (P) summarize the trajectories for migrating cells No. 42 and No. 22, respectively. Scale bar: 10 μm. Q: The directions of migration for the 13 cells presented in Suppl. Movies S3 and S4. Green arrows: Anterior migration. Blue arrows: Posterior migration. Magenta arrows: Zig-zag migration. The time taken for each migration is shown at the end of the arrows. Scale bar: 10 μm.
Reprinted from Gene expression patterns : GEP, 28, Nikaido, M., Izumi, S., Ohnuki, H., Takigawa, Y., Yamasu, K., Hatta, K., Early development of the enteric nervous system visualized by using a new transgenic zebrafish line harboring a regulatory region for choline acetyltransferase a (chata) gene, 12-21, Copyright (2018) with permission from Elsevier. Full text @ Gene Expr. Patterns