
|
Fig. S5
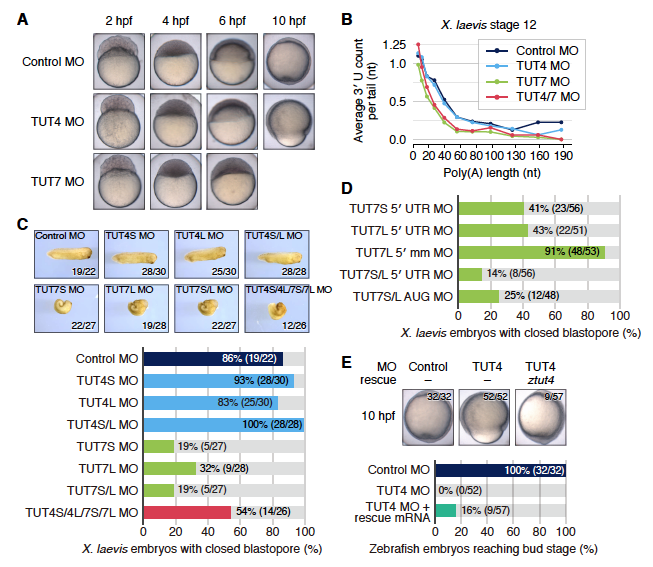
Morphological and molecular effects of TUT4/7 knockdown in zebrafish and X. laevis embryos, Related to Figure 4
(A) Zebrafish embryos showing the effects of individual injections of TUT4 and TUT7 morpholinos. The images for control embryos are duplicated from those in Figure 4A for easier comparison. See also Figure 4A.
(B) Average terminal uridine counts of poly(A) tails of all non-histone mRNAs in stage 12 frog embryos that were injected with different morpholinos.
(C) Morphological effects of TUT4 and TUT7 knockdown in X. laevis embryos. The allotetraploid frog has two evolutionarily separate copies for both TUT4 and TUT7 genes. The TUT4S and TUT7S MOs target the RNAs transcribed from shorter chromosomes, whereas the TUT4L and TUT7L MOs target those from longer chromosomes. The numbers on the lower right side of each picture indicate that of embryos with morphology indistinguishable from the represented embryo. The bar chart on the bottom enables the comparison of embryo counts without defects in blastopore closure for each treatment. See also Figures 4B and 4D.
(D) Counts of frog embryos with normal blastopore closure after injection of morpholinos targeting different regions of TUT7. 5′ UTR morpholinos bind to the upstream positions adjacent to the start codons of TUT7S and TUT7L. Start codon-targeting morpholinos (AUG MOs) are able to form stable pairing near the start codons to inhibit the translation. The mismatch (mm) control morpholinos are designed based on the AUG MOs, although they are modified in five positions for each to disrupt pairing with their respective targets. See also Figures 4B and 4D.
(E) Developmental defects of TUT4 morphants and their rescue by zebrafish tut4 mRNA injection. Control (leftmost) or TUT4 (the rest) morpholinos were injected into zebrafish embryos together with gfp control (left two) or tut4 (rightmost) mRNAs. The counts of embryos having indistinguishable morphology from the represented embryo are shown in the upper right side of each picture. The bar chart on the bottom enables the comparison of embryo counts that succeeded in reaching the bud stage at 10 hpf for each condition.