
|
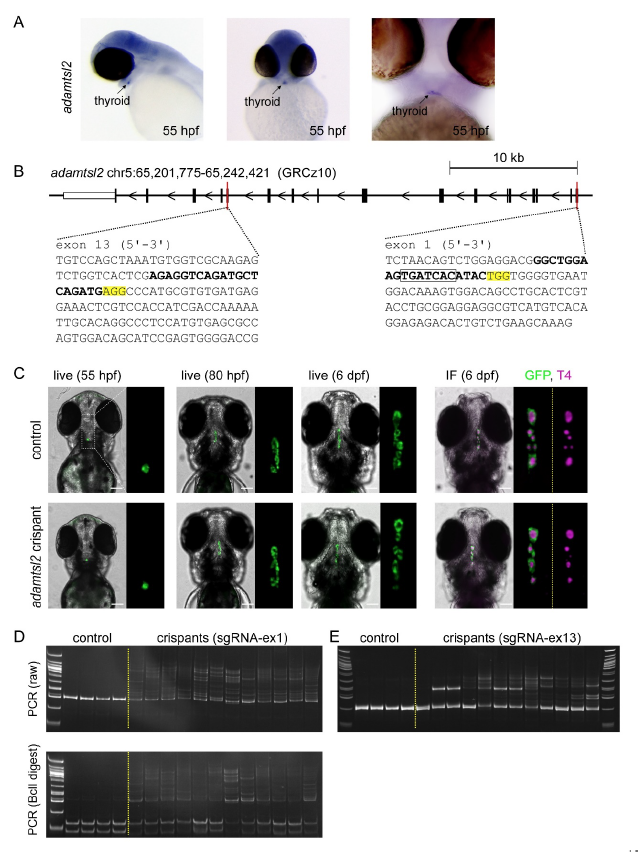
Fig. S8
Characterization of adamtsl2 crispants. (A) adamtsl2 mRNA is expressed at high levels in the zebrafish thyroid primordium (arrow) as demonstrated by whole-mount in situ hybridization. Lateral and frontal views of 55 hpf embryos stained with an adamtsl2-specific riboprobe are shown. (B) Zebrafish adamtsl2 genomic locus on chromosome 5 with sequences for exon 1 and exon 13. Underlined sequences are target sites for sgRNA-ex1 and sgRNA-ex13, respectively. PAM sequences are highlighted in yellow and the boxed sequence in exon 1 is the BclI restriction enzyme recognition site. (C) Thyroid phenotyping of adamtsl2 crispants did not reveal alteration in thyroid morphogenesis or thyroid function. Results shown are from an injection experiment with sgRNA-ex13 and similar results were obtained with sgRNA-ex1. Epifluorescence live imaging of Tg(tg:nlsEGFP) zebrafish at 55 hpf, 80 hpf, and 6 dpf. Ventral views of the head region and 3-fold magnified views of the thyroid region (GFP channel only) are shown for non-injected controls and adamtsl2 crispants. Whole-mount immunofluorescence (IF) staining of 6 dpf Tg(tg:nlsEGFP) zebrafish for EGFP (thyroid cells) and thyroxine (colloidal T4). Ventral views of the head region (anterior is to the top) and 3-fold magnified views of the thyroid region (GFP, T4) are shown. Scale bars: 100 μm. (D) Polyacrylamide gel electrophoresis (PAGE) of PCR amplicons generated with primers spanning the target site of sgRNA-ex1. Upper panel shows a gel for PCR amplicons of WT larvae (single PCR product of 206 bp) and adamtsl2 crispants (multiple slow-migrating heteroduplex bands). Lower panel shows a gel for PCR amplicons digested with BclI. Note complete digestion of PCR amplicons from WT larvae resulting in two restriction fragments of 111bp and 95 bp, respectively. Images of fulllength gels are shown in Supplementary Figure 9A,B. (E) PAGE analysis of PCR amplicons generated with primers spanning the target site of sgRNA-ex13. Gel showing PCR amplicons of non-injected WT larvae (single PCR product of 151 bp) and adamtsl2 crispants (multiple slow-migrating heteroduplex bands in most samples). Full-length gel is shown in Supplementary Figure 9C.