
|
Fig. S5
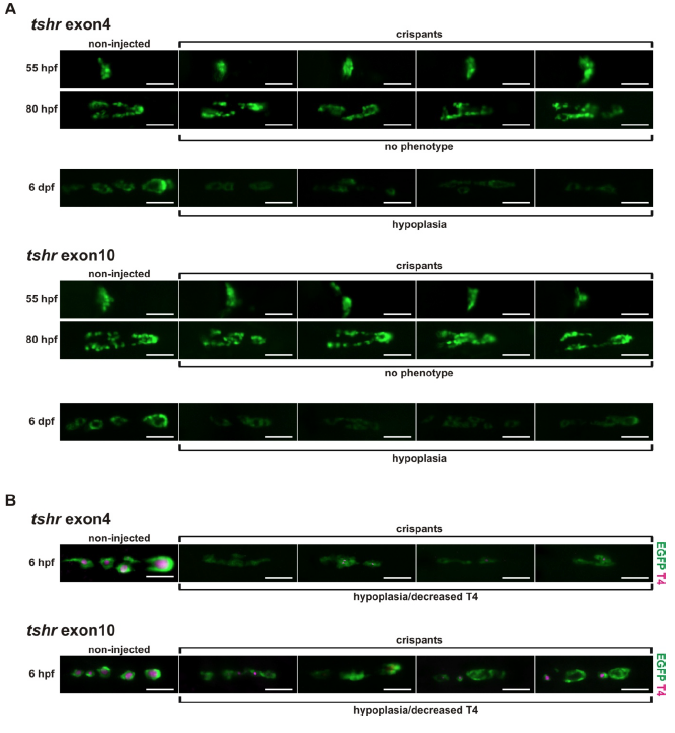
Phenotypic spectrum of tshr crispants. (A) Epifluorescence live imaging of Tg(tg:nlsEGFP) zebrafish larvae injected with Cas9 protein and sgRNAs targeting exon 4 or exon 10 of tshr, respectively. Ventral views of the thyroid region (anterior to the right) are shown for non-injected control fish and four crispants. Images were aquired at 55 hpf, 80 hpf, and 6 dpf. No deviation from control thyroid morphology was evident in tshr crispants at 55 and 80 hpf. By 6 dpf, thyroids of tshr crispants had an atrophic/hypoplastic appearance and displayed a greatly reduced GFP reporter signal. (B) Whole-mount immunofluorescence staining of Tg(tg:nlsEGFP) zebrafish for EGFP and colloidal T4 at 6 dpf. Ventral views of the thyroid region (anterior to the right) are shown for non-injected control fish and different tshr crispants displaying hypothyroidism (decreased T4 staining), variable thyroid hypoplasia and reduced GFP expression. Scale bars: 50 μm.