
|
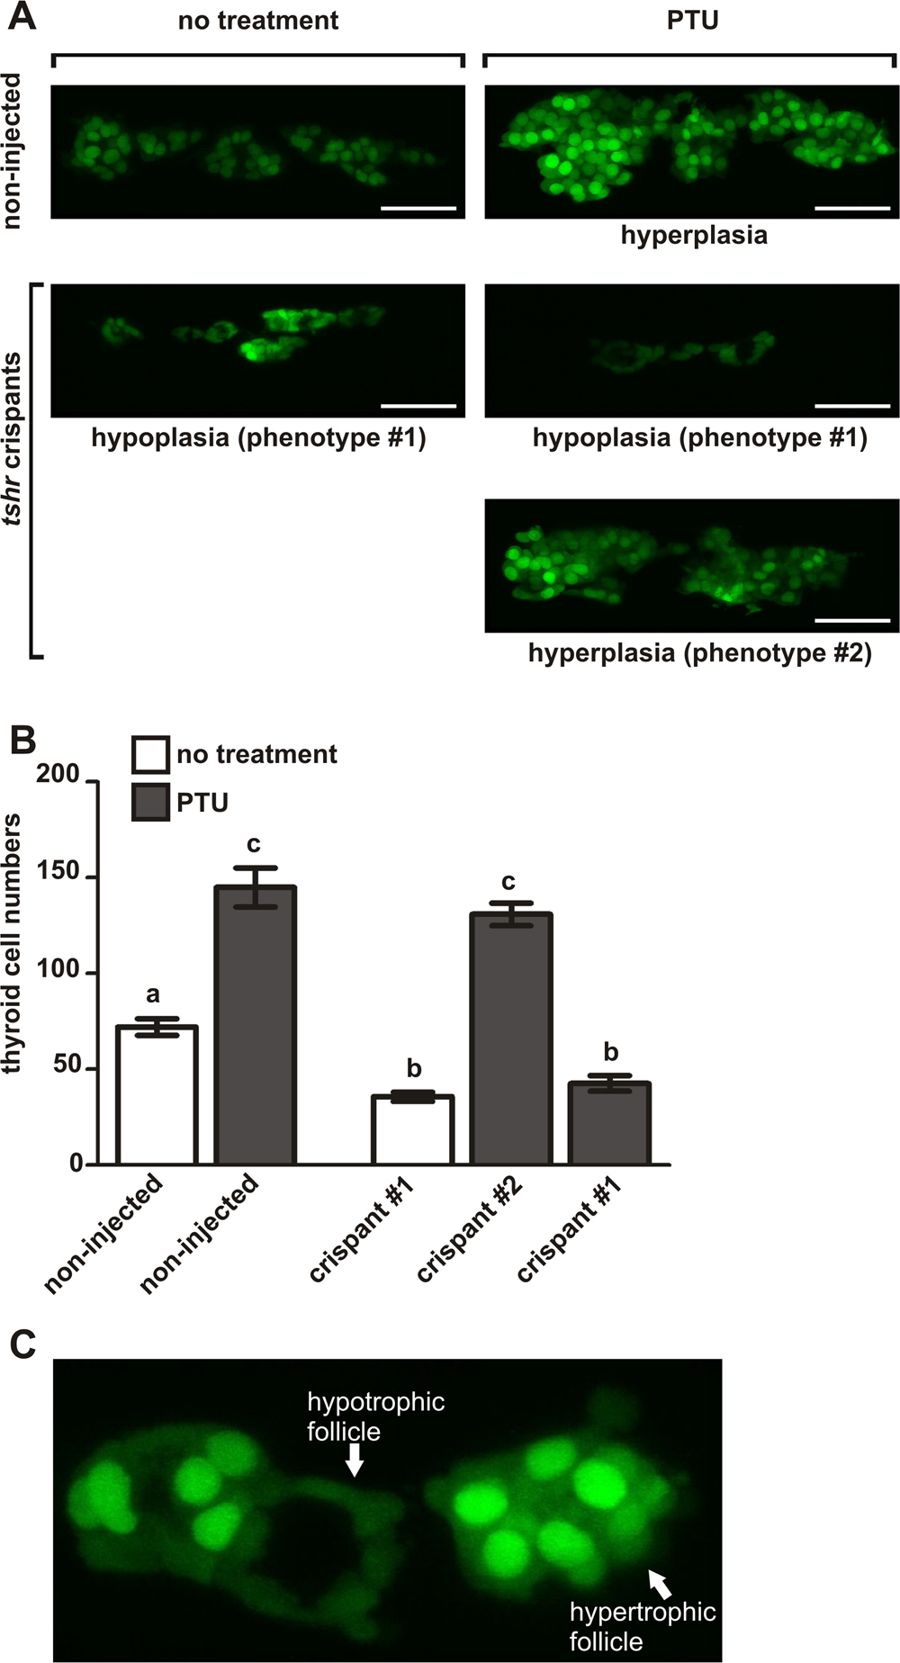
Fig. 6
tshr crispants are resistant to PTU-induced thyroid hyperplasia. (A) Confocal live imaging of Tg(tg:nlsEGFP) zebrafish at 6 dpf. Three-dimensional reconstructions of confocal images of the thyroid region (ventral views, anterior to the left, scale bars: 40 µm) are shown for tshr crispants and non-injected siblings raised in the presence or absence of 30 mg/L phenylthiourea (PTU). Non-injected control larvae developed severe thyroid hyperplasia in response to PTU treatment. In contrast, only about 50% of the PTU-treated tshr crispants displayed a similar thyroid enlargement (phenotype #2). The remaining tshr crispants showed an almost complete resistance to PTU-induced thyroid enlargement and instead presented with a hypoplastic/atrophic thyroid phenotype (phenotype #1) similar to that seen in tshr crispants raised in the absence of PTU. (B) Quantification of thyroid follicular cell number in the different phenotypic groups at 6 dpf. Means ± S.E.M. are shown (N = 12–16). Different letters indicate significant differences between groups (P < 0.05, Tukey’s multiple comparison test). (C) Confocal live imaging identified mosaicism in cellular responses to PTU treatment in several tshr crispants. Note the atrophic characteristics of the follicle in the middle (low reporter expression, flat epithelium) compared to the marked hypertrophy/hyperplasia of the two neighbouring follicles.