
|
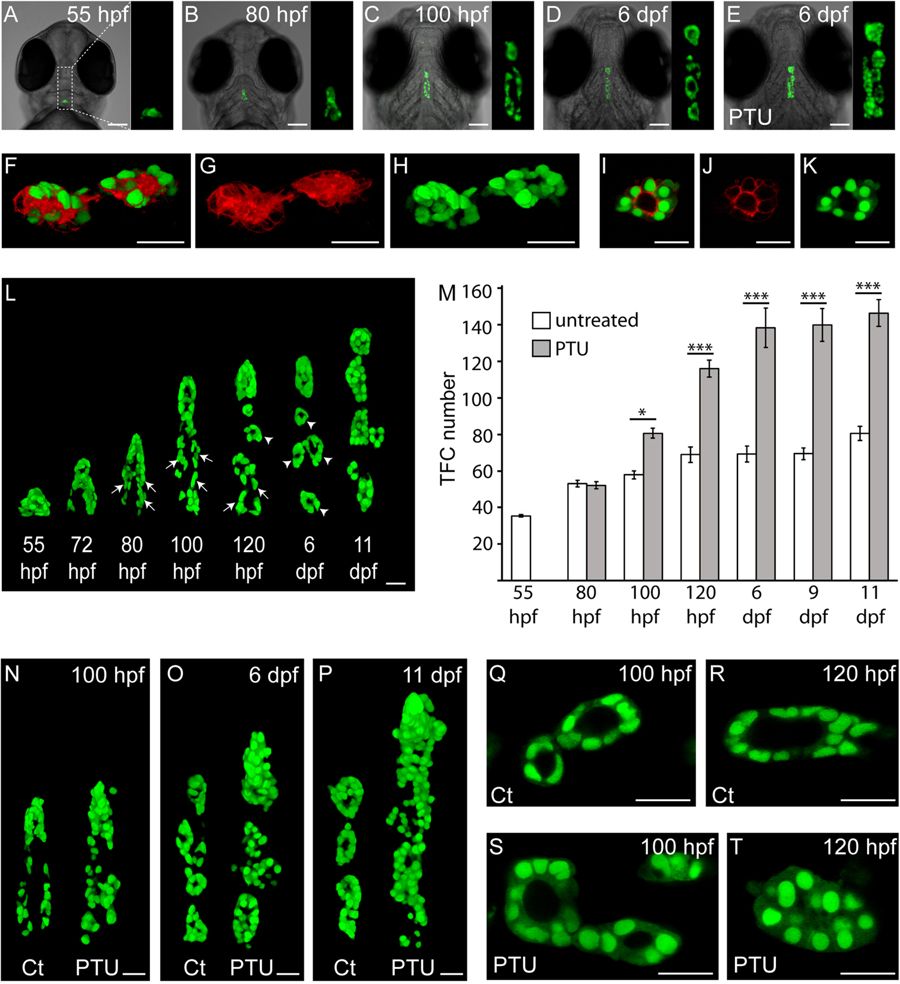
Fig. 1
Live imaging of transgenic Tg(tg:nlsEGFP) zebrafish permits real-time analysis of thyroid morphogenesis. (A–E) Epifluorescence microscopy of live Tg(tg:nlsEGFP) zebrafish (ventral view, anterior is to the top) is sufficiently sensitive to monitor stage-dependent changes in thyroid morphology during normal thyroid development (see A–D) and to detect the goitrous thyroid enlargement caused by PTU treatment (E). For each embryo shown, three-fold magnified views of the thyroid region are displayed (GFP channel). (F–K) Confocal analyses of double transgenic Tg(tg:mCherry;tg:nlsEGFP) larvae (100 hpf) confirms thyroid-specific co-expression of membrane-tethered mCherry (F,G,I,J) and nuclear EGFP reporters (F,H,I,K). 3D reconstruction of confocal images (F–H) and individual confocal sections (I–K) are shown. Ventral view, anterior is to the left. (L) Live imaging of a developmental series of Tg(tg:nlsEGFP) fish by confocal microscopy highlights the progressive expansion of thyroid tissue along the anterio-posterior axis (ventral view, anterior is to the top), the increase in thyroid cell number and the re-organization of cord-like cell clusters (arrows) into definitive follicular structures (arrowheads) during normal development. (M) Quantification of thyroid follicular cell (TFC) number in untreated control and PTU-treated zebrafish. Results are shown as means ± S.E.M (N = 6–10). Asterisks denote significant differences between treatment means at a given developmental stage (*P < 0.05, ***P < 0.001, Student’s t-test). (N–P) Comparison of thyroid morphologies between untreated control (Ct) and PTU-treated fish at different time point during the course of PTU treatment. Note the increased size and hyperplasia of thyroids from PTU-treated fish at 6 and 11 dpf. 3D reconstruction of confocal images obtained in live fish are shown (ventral view, anterior is to the top). (Q–T) Confocal sections highlight the stage-dependent increases in follicle size and luminal diameter in untreated control (Ct) fish (see Q,R). In PTU-treated fish, live imaging (ventral view, anterior is to the left) permitted monitoring of goitrous responses including early onset of thyroid cell hypertrophy (S), collapse of follicular lumina (T) and thyroid cell hyperplasia (T). Scale bars: 100 µm (A–E) and 20 µm (F–L, N–T).