
Fig. S1
- ID
- ZDB-IMAGE-180703-60
- Publication
- Spikol et al., 2018 - Separate roles for Med12 and Wnt signaling in regulation of oxytocin expression
- All Figures
- Figures for Spikol et al., 2018
|
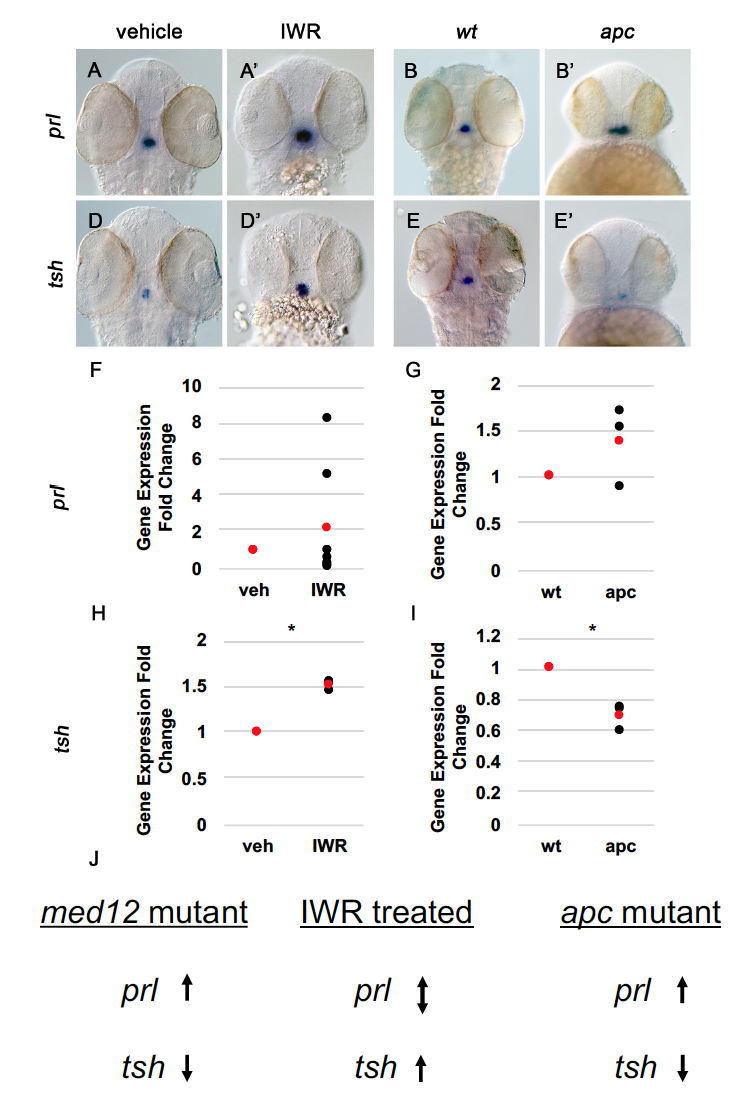
Fig. S1
Alterations in Wnt signaling modulate prl and tsh gene expression in the pituitary. (A, A’, B, B’, D, D’, E, E’) are all dorsal views of WISH in 48 hpf embryos magnified x100. (A, D) wt siblings, vehicle treated. (A’, D’) wt, IWR-treated embryos. (B, E) wt siblings. (B’, E’) apc mutant embryos. (A, A’, B, B’) prl expression in the pituitary. (D, D’, E, E’) tsh expression in the pituitary. Expression of prl (F, H) and tsh (G, I) were measured in IWR-treated (F, H) and apc mutant (G, I) 48 hpf embryos using RT-qPCR. Gene expression values were normalized to an endogenous control, beta actin 2 (actb2), and are expressed as fold changes relative to wt sibling, or vehicle-treated wt sibling controls. Dot plots show three biological replicates (black) and the mean (red). (J) Schematic comparing prl and tsh gene expression changes in med12 mutant embryos, IWR-treated embryos, and apc mutant embryos.