
|
Fig. 4
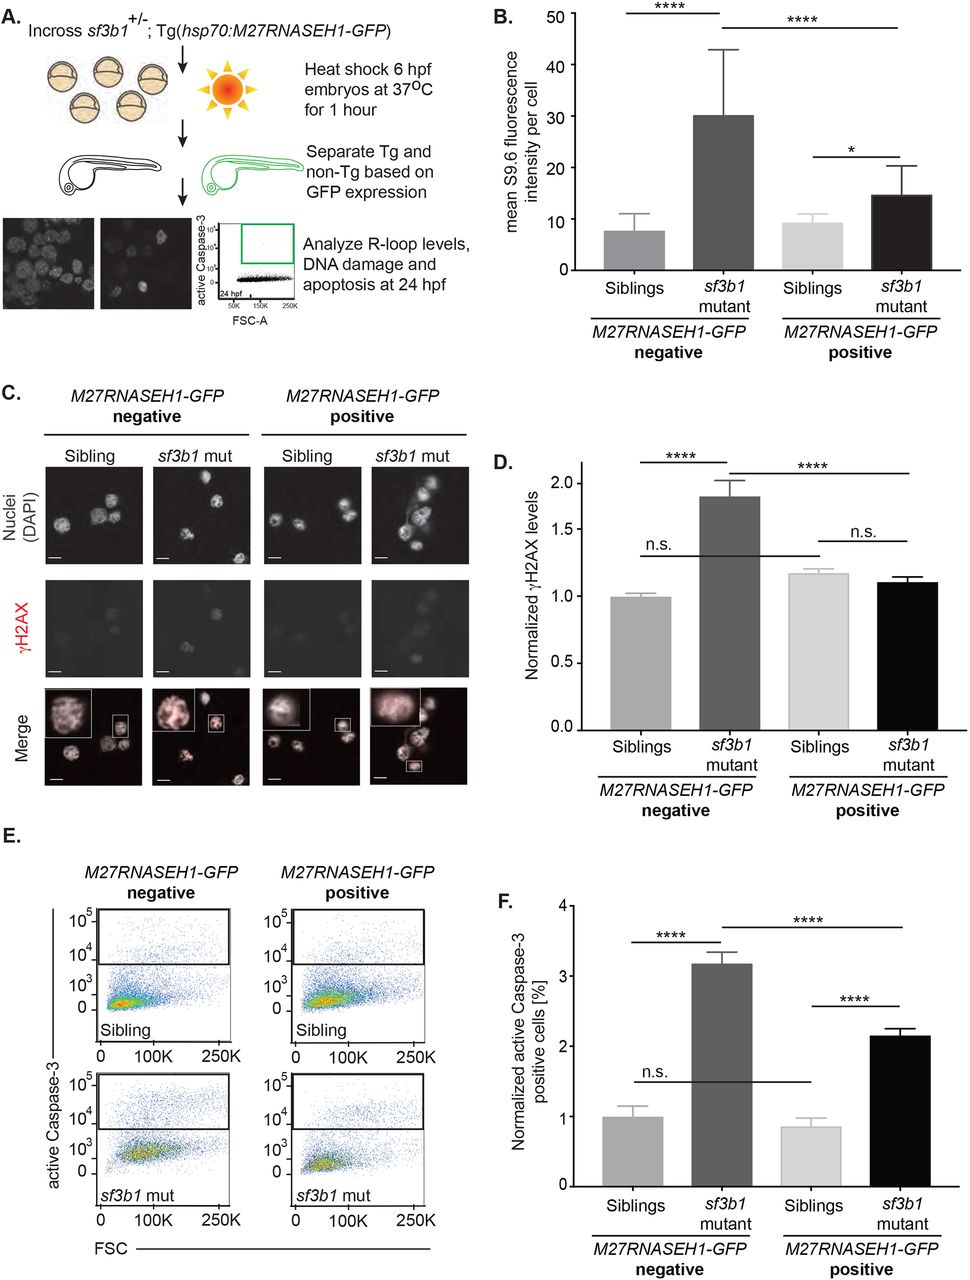
RNASEH1 reverses R-loops, DNA DSBs and apoptosis in spliceosomal mutant zebrafish. (A) Schematic of the RNASEH1 overexpression experiment. (B) Quantification of R-loop levels in cells isolated from 24 hpf Tg(hsp70:M27RNASEH1-GFP)-negative and Tg(hsp70:M27RNASEH1-GFP)-positive sf3b1hi3394aTg mutant and wild-type siblings following heat shock induction. (C) Confocal images showing immunofluorescence of nuclei (DAPI) and DNA damage (γH2AX) in cells isolated from 24 hpf Tg(hsp70:M27RNASEH1-GFP)-negative and Tg(hsp70:M27RNASEH1-GFP)-positive sf3b1hi3394aTg mutant and wild-type siblings. The lower panel is a merged image with an inset of a single cell to better show γH2AX staining. (D) Quantification of γH2AX fluorescence intensity in sf3b1hi3394aTg mutant and wild-type siblings. (E) Representative flow cytometry plots showing active caspase-3 levels on the y-axis and forward scatter (FSC) on the x-axis. (F) Quantification of active caspase-3 levels in 24 hpf Tg(hsp70:M27RNASEH1-GFP)-negative and Tg(hsp70:M27RNASEH1-GFP)-positive sf3b1hi3394aTg mutant and wild-type siblings following heat shock induction. For images, 63× magnification with 6.5× zoom. Scale bars: 5 μm. Error bars represent s.e.m. P-values were calculated by one-way ANOVA with Sidak's multi-testing correction. *P<0.05; **P<0.01; ***P<0.001; **** P<0.0001; n.s., not significant. For D and F, data represent normalized values across three replicates.