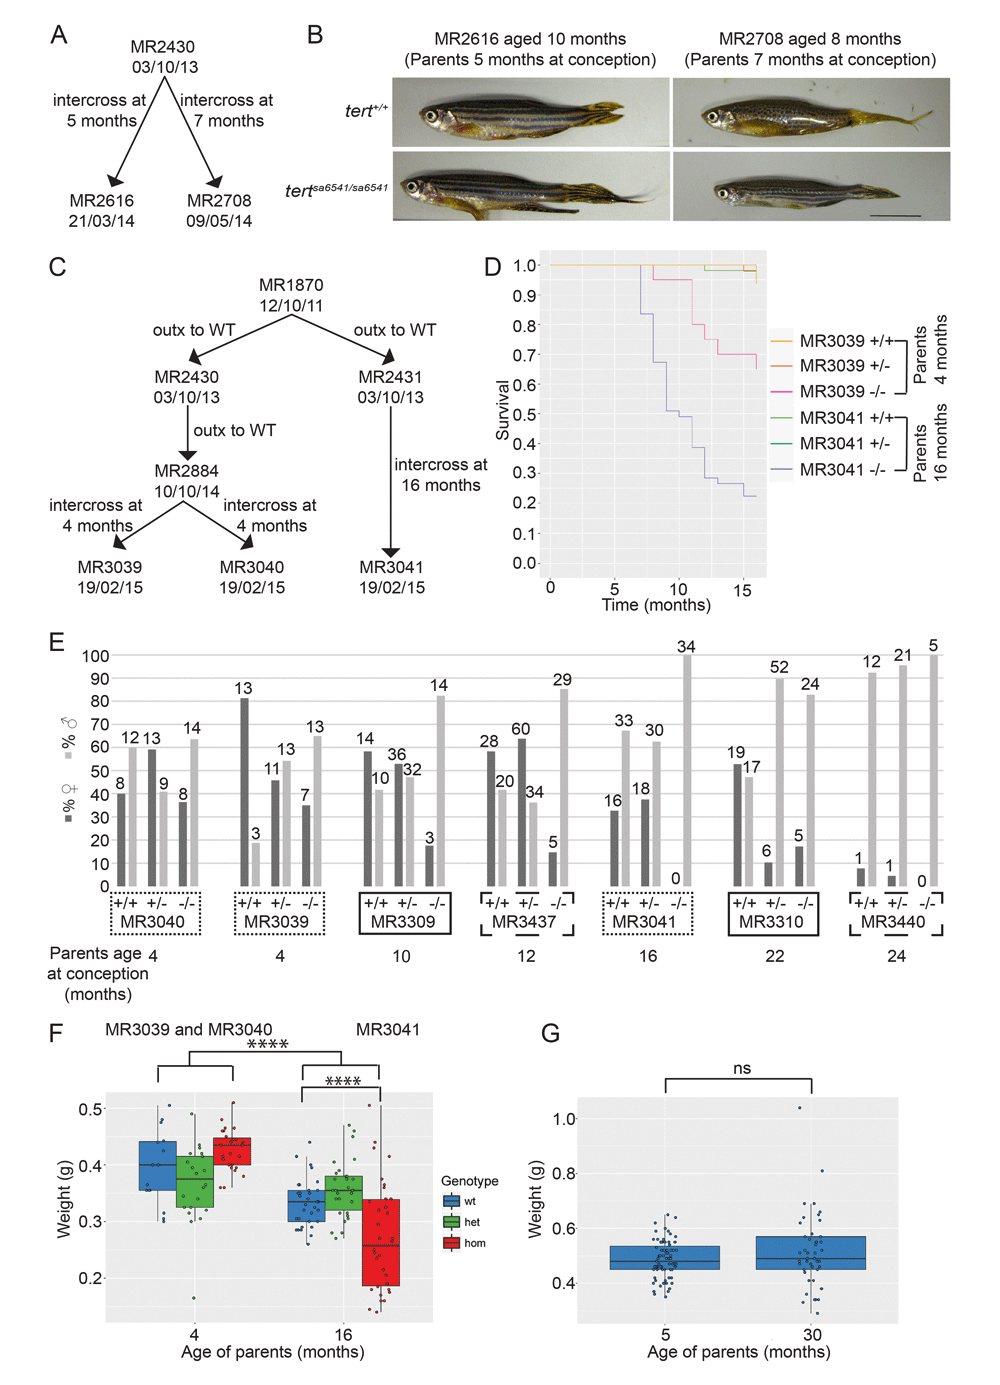
Fig. 2
The age of heterozygous tertsa6541/+ parents affects the phenotype of their offspring.
(A) Family tree depicting relationship between lines shown in (B). Lines numbers are indicated according to our fish stock database with date of birth underneath. (B) Homozygous fish from older heterozygous parents show signs of body wasting at a younger age than those from younger heterozygous parents. 8 month old fish from 7 month old heterozygous parents appear older than 10 month old fish from 5 month old heterozygous parents. Scale bar: 10mm. (C) Family tree depicting relationship of lines shown in (D) and (F). (D) Homozygous fish from 16 month old heterozygous parents have reduced survival compared to homozygotes from 4 month old heterozygous parents which were raised at the same time. (E) Sex ratios of intercrosses from tertsa6541/+ parents of different ages. Patterned boxes around line numbers indicate which lines were raised simultaneously in the nursery. Absolute numbers are indicated above each bar. (F) Box plot with scatter of weights of male fish from 4 or 16 month old heterozygous parents showing that fish from older parents weigh less than those from younger parents. (G) Box plot with scatter showing no significant difference between the weights of wild-type fish from wild-type parents aged 5 or 30 months.

