
Image
|
Figure Caption
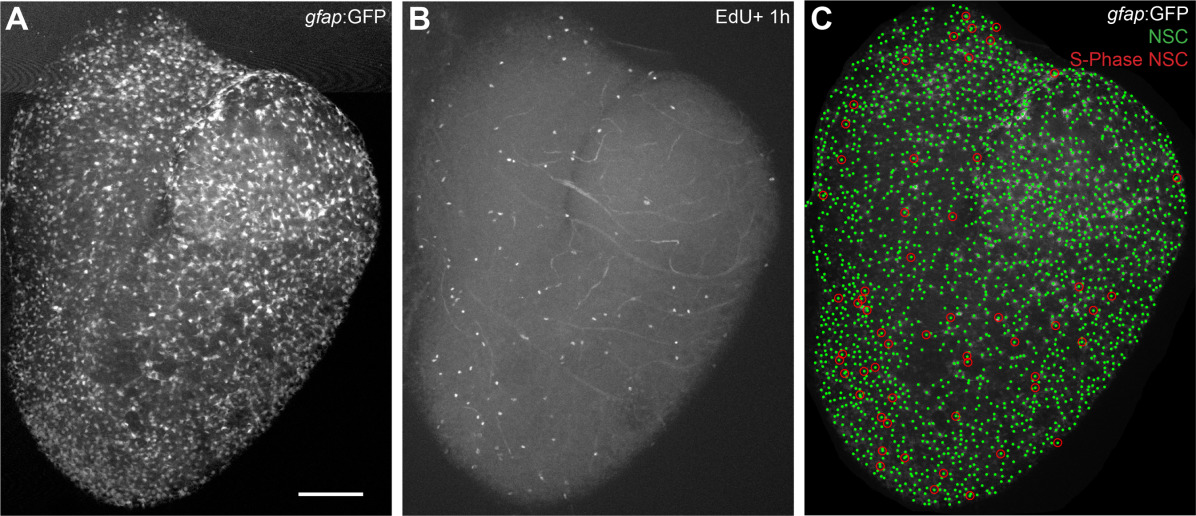
Fig. 4
Spatial pattern of NSC divisions. NSCs are identified in the gfap:GFP channel (A) using SCIP. Cells in S‐phase were automatically identified by EdU signal and manually verified (B). S‐phase NSCs are identified as cells that appear both in the gfap:GFP and in the EdU channel (C). Scale bar: 100 µm.
Acknowledgments
This image is the copyrighted work of the attributed author or publisher, and
ZFIN has permission only to display this image to its users.
Additional permissions should be obtained from the applicable author or publisher of the image.
Full text @ Cytometry A