
Image
|
Figure Caption
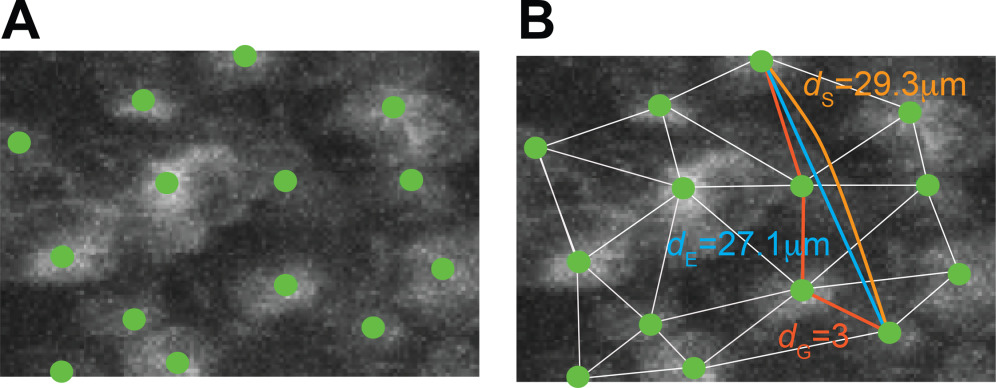
Fig. 3
Three metrics are defined on the hemispheres. NSCs are identified (A) and then used to calculate the Euclidean distance dE (blue line), the surface distance dS (orange line) and the graph distance dG (red lines) between all pairs of identified cells on the 2D surface (B). For the surface distance, the shortest path between two cells in 3D is projected on the surface fitted with SCIP. For the graph distance, the shortest path in a network derived from a Delaunay triangulation is calculated. Identified NSCs are shown in green on top of the gfap:GFP signal.
Acknowledgments
This image is the copyrighted work of the attributed author or publisher, and
ZFIN has permission only to display this image to its users.
Additional permissions should be obtained from the applicable author or publisher of the image.
Full text @ Cytometry A