
|
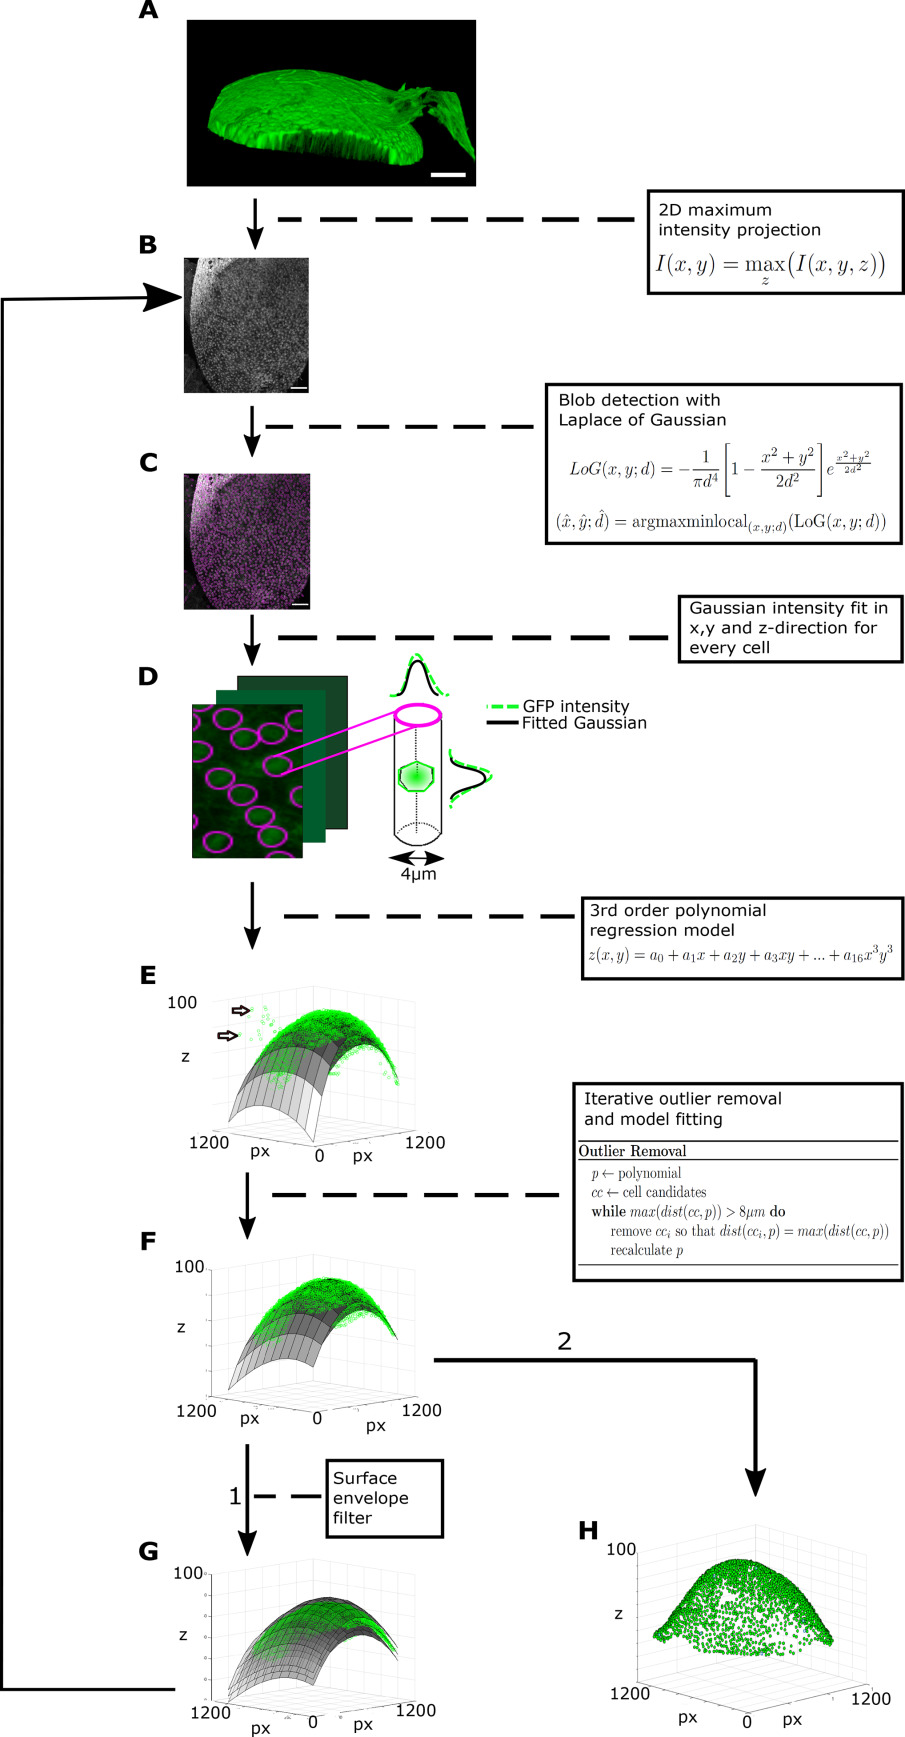
Fig. 2
SCIP for NSCs in the adult zebrafish brain. Raw 3D data (A) is transformed into 2D images (B) via 2D maximum intensity projection. Cell somata are touching each other on the surface, without intermediate space. Cell centers display a high GFP intensity and are used for identification. A blob detection using LoG identifies cell candidates (C). A Gaussian curve is fitted to the intensity profile of a cylinder with 4 µm diameter along z of every cell candidate (D). The mean of the Gaussian is taken as the z‐coordinate of cell candidate centroid. A surface based on a 3rd order polynomial regression model is fitted to all centroids (E). Cells that are further away than two cell diameters (∼16 µm) are excluded step by step by removing iteratively the most distant outlier and recalculate the surface (F). To remove remaining image artifacts an envelope is placed in 20 µm distance around the surface (G). All pixels outside this envelope are set to background intensity. Afterwards the pipeline starts over again at (B) using the filtered image stack without image artifacts. (H) The resulting cell centroids can now be used for further analyses. Scale bars: 50 µm.