Fig. 2
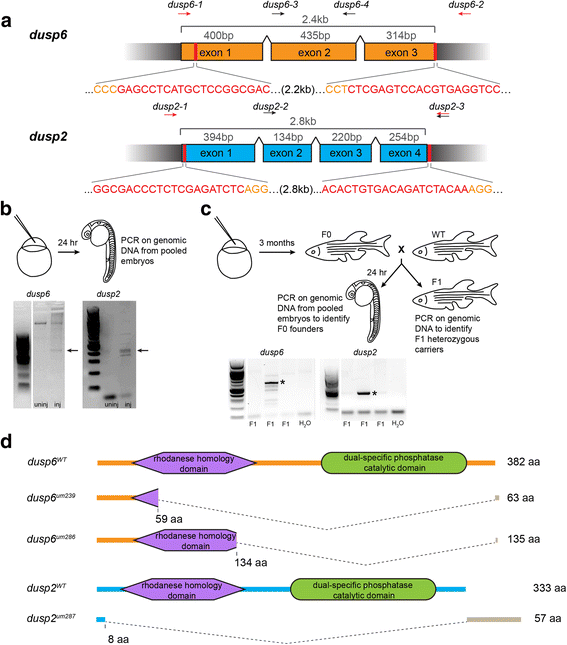
CRISPR genome editing yields loss of function mutants for dusp6 and dusp2. a Schematic of the genomic sequence for dusp6 and dusp2 with the length of each exon and total coding sequence indicated. Black wedges represent introns. Vertical red lines and red nucleotides denote the CRISPR target sequence, and orange nucleotides indicate PAM sequence. Arrows above each schematic indicate the approximate locations of genotyping primers used to detect CRISPR-induced deletion alleles (red arrows) and wildtype alleles (black arrows; see Additional file 2). b Identification of active guide RNAs. Genomic DNA was extracted from pools of injected embryos and PCR-amplified to detect CRISPR-induced deletions. Arrows point to PCR products resulting from successful deletions. c Identification of F0 founder fish. Adult F0 fish were crossed to wildtype and the resulting offspring genotyped as in B. Asterisks indicate transmission of deletions to F1 offspring. d Predicted peptide sequences of the identified mutant alleles for dusp6 and dusp2. The large dashed wedges represent the location of CRISPR-induced deletions, and the gray bars represent residues that are read out of frame prior to a premature stop codon. Amino acid numbers below each peptide sequence indicate the residue affected by the deletion, and the numbers to the right indicate the length of the resulting peptide

