
|
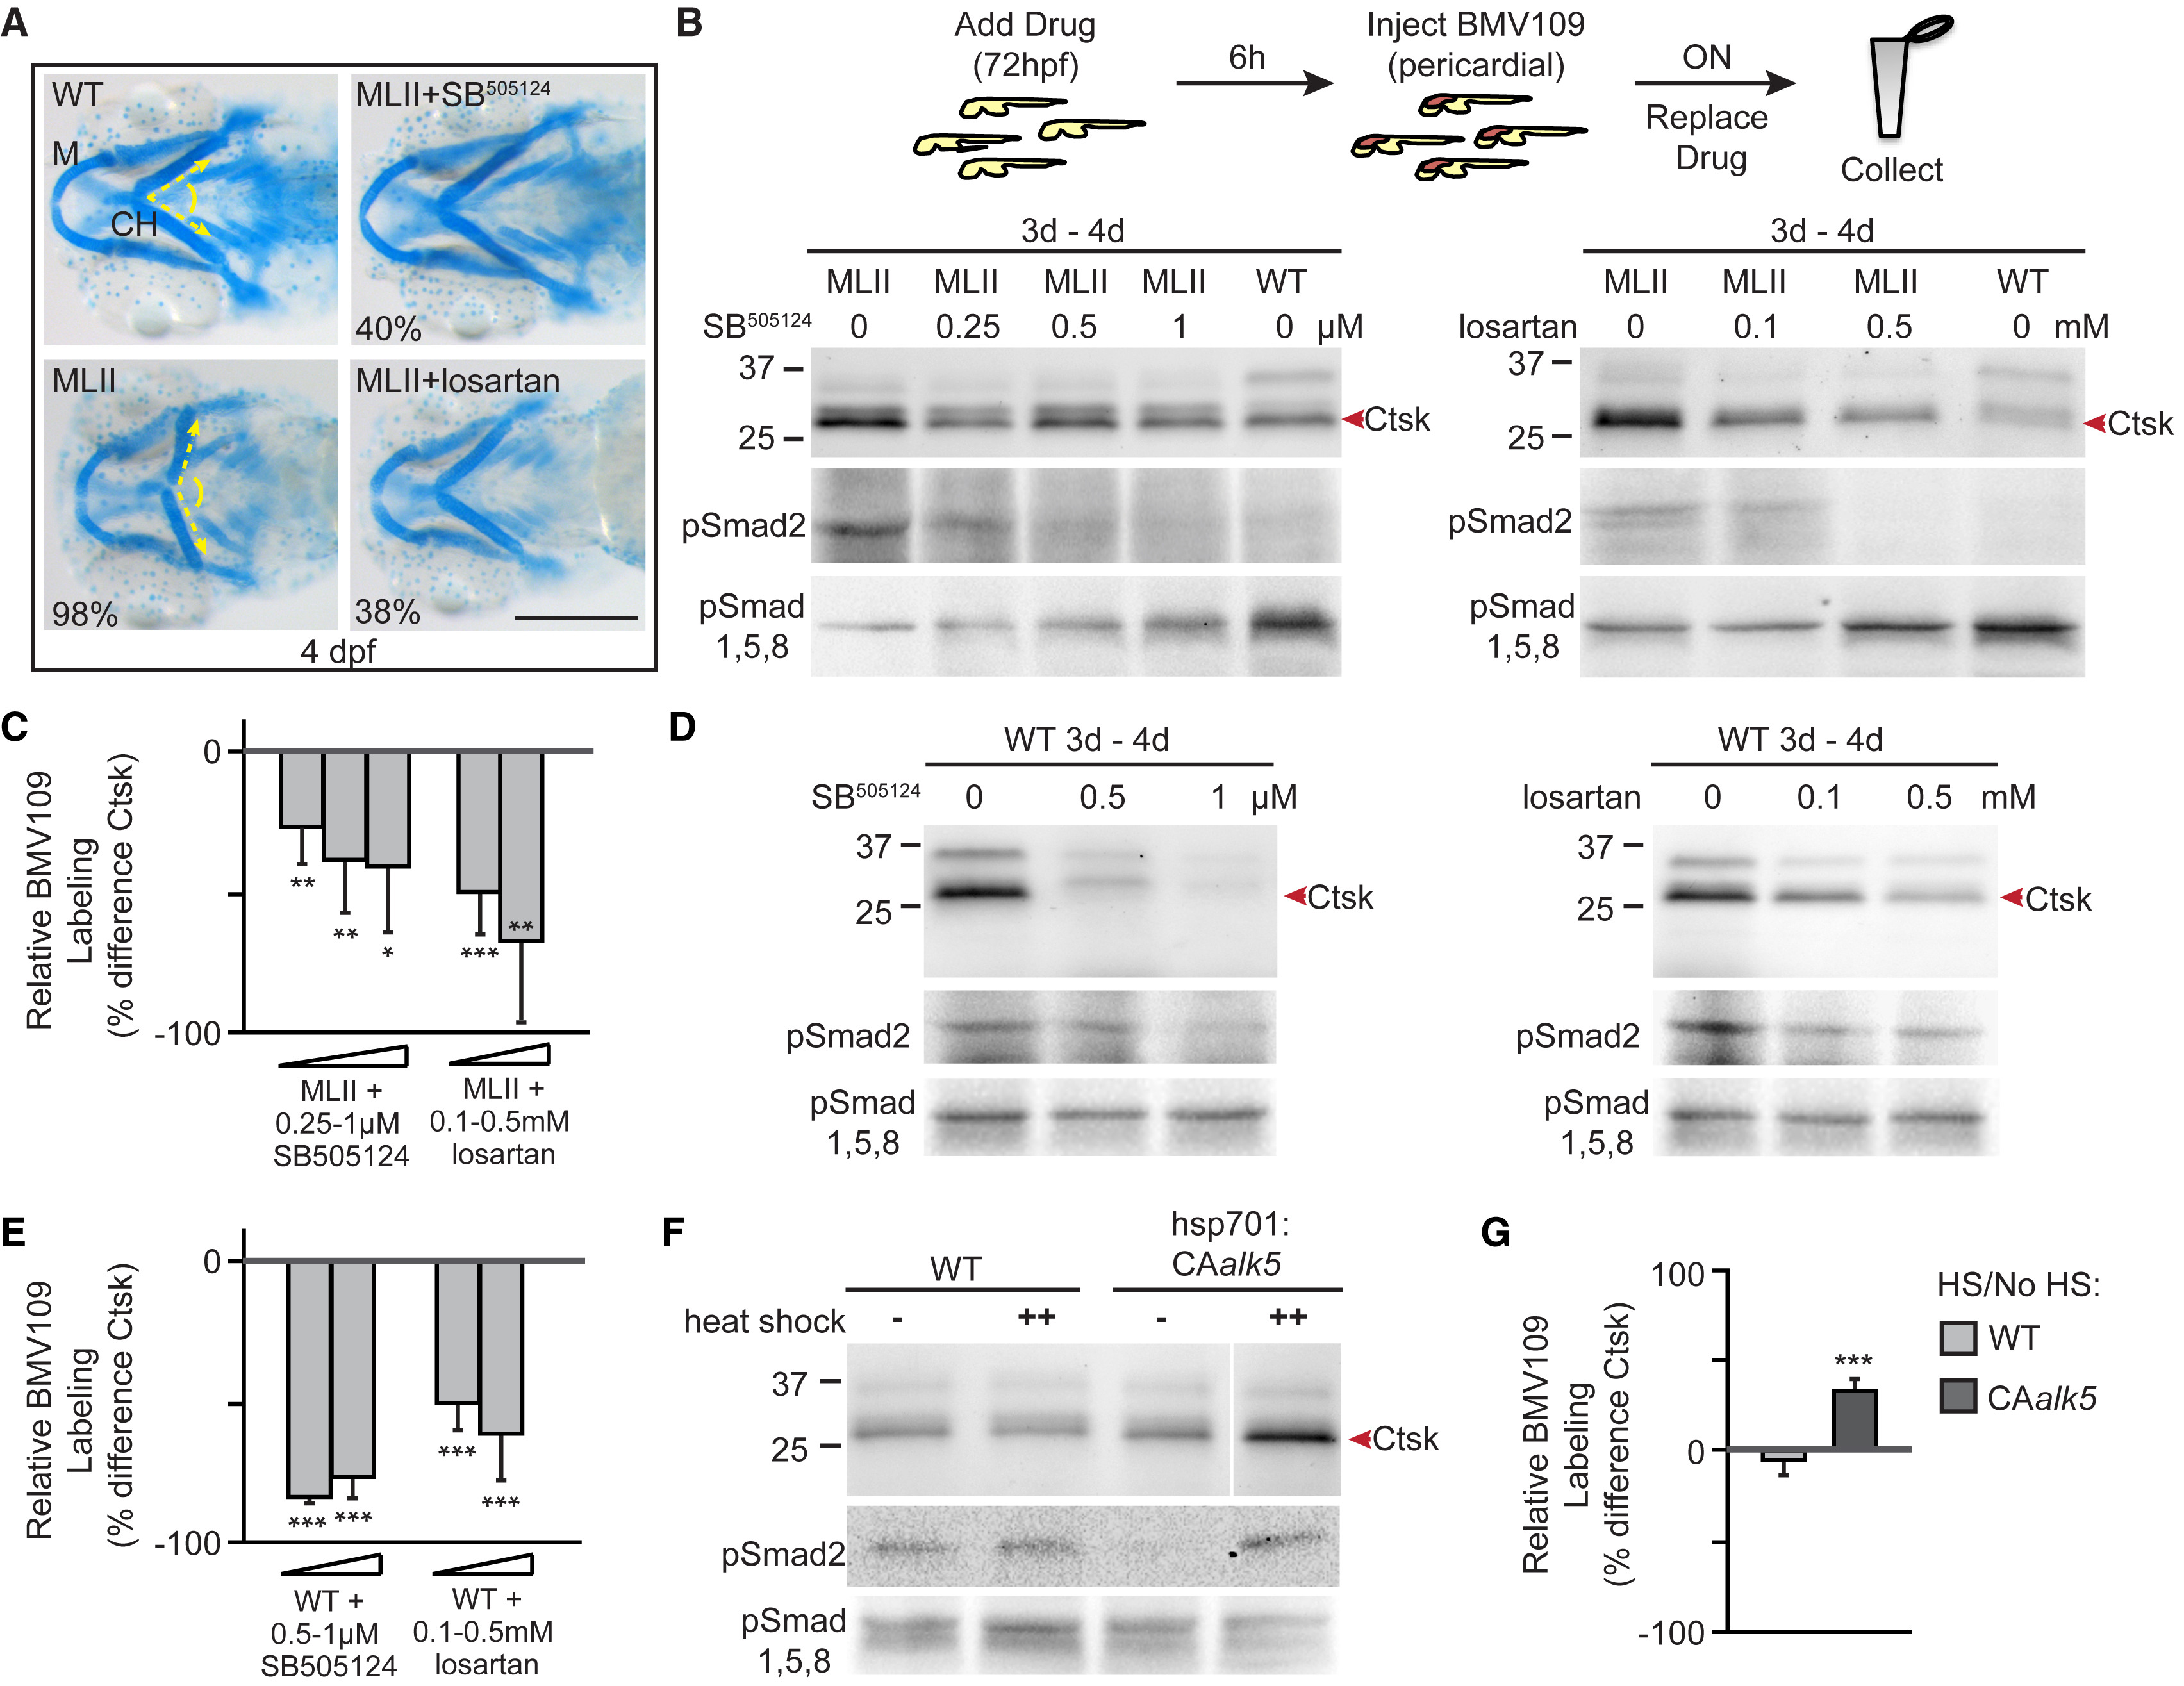
Fig. 4
TGF-ß Inhibition Ameliorates MLII Pathology and Reduces Ctsk Activity
(A) Alcian blue stains of 4 dpf WT, MLII, and TGF-ß-inhibited embryos. Shown are Meckel’s (M) cartilage and the angle of ceratohyal (CH) cartilages. The angle of cartilage articulation is illustrated by yellow dotted lines. Scale bar, 10 μm. Percent values are the number of embryos that resembled the picture (i.e., were rescued). n = 75–100 embryos from 3 experiments.
(B) Schematic illustrating the treatment regimen. Shown are in-gel analyses of BMV109 reactivity (top), immunoblots of phosphorylated pSmad2 (TGF-ß effector, center), and phosphorylated pSmad1,5,8 (BMP effector, bottom). n = 4 experiments.
(C) Quantitation of BMV109-labeled Ctsk in treated and untreated MLII embryos from 4 experiments. Error bars, SD; ∗p < 0.05, ∗∗p < 0.01, ∗∗∗p < 0.001.
(D) In-gel analyses of BMV109-labeled (top) WT embryos, immunoblots of phosphorylated pSmad2 (TGF-ß effector, center), and phosphorylated pSmad1,5,8 (BMP effector, bottom). n = 4 experiments.
(E) Quantitation of BMV109-labeled Ctsk in treated and untreated WT embryos from 4 experiments.
(F) Gels of BMV109 labeling after TGF-ß induction (top) and immunoblots for psmad2 and pSmad1,5,8 (bottom). n = 5 experiments.
(G) Quantitation of BMV109-labeled Ctsk before and after heat shock. Error bars, SD; ∗∗∗p < 0.001.
See also Figure S2.