
|
Fig. S4
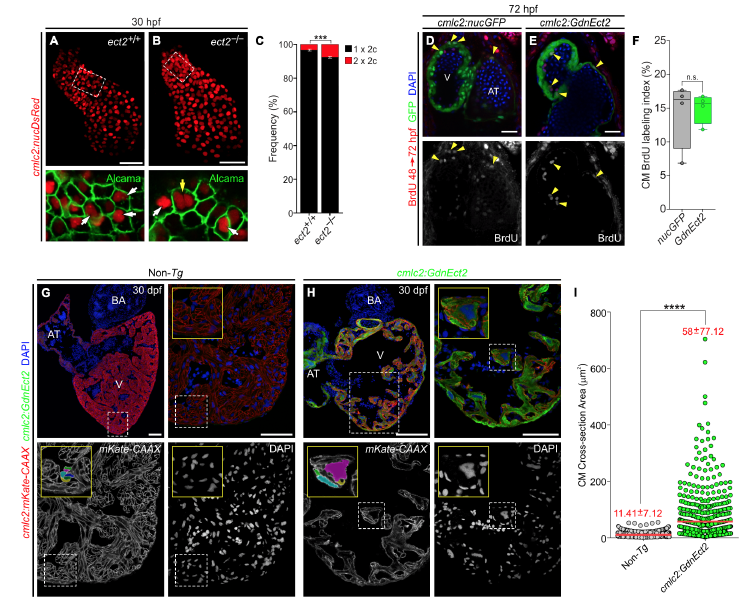
Ect2 is required for cardiomyocyte cytokinesis, but dispensable for entry into S-phase, and constitutive myocardial dnEct2 expression induces cardiomyocyte hypertrophy, Related to Figure 2. (A,B) Confocal projections of embryonic hearts of ect2+/+ (A) and ect2-/- (B) animals carrying the Tg(cmlc2:nucDsRed) transgene at 30 hpf. Single confocal planes of boxed regions are shown at higher magnification with Alcama immunostaining to highlight plasma membranes. White and yellow arrows point to diploid and polyploid cardiomyocytes, respectively. (C) Quantification of indicated cardiomyocyte populations from ect2+/+ (n=4) and ect2-/- (n=4) hearts at 30 hpf (mean±s.d; ** P<0.01 by two-tailed unpaired t-test). (D,E) Single confocal planes of 72 hpf Tg(cmlc2:nucGFP) (D) and Tg(cmlc2:GdnEct2) (E) animals exposed to BrdU between 48 and 72 hpf, immunostained for GFP and BrdU and counterstained with DAPI. Yellow arrowheads indicate BrdU+ cardiomyocyte nuclei. The BrdU signals from (D) and (E) are shown below. (F) Quantification of the Tg(cmlc2:nucGFP) (n=4) and Tg(cmlc2:GdnEct2) (n=4) cardiomyocyte BrdU labeling index at 72 hpf (mean ± s.d, non-significant by two-tailed unpaired t-test). (G,H) Ventricular sections from 30 dpf non-Tg (G) or Tg(cmlc2:GdnEct2) animals (H) carrying the Tg(cmlc2:mKate-CAAX) transgene to label cardiomyocyte cell membranes. Hearts were immunostained to detect mKate and GFP and counterstained with DAPI. Boxed regions are shown at higher magnifications (right and insets). Individual fluorescent channels showing mKate and DAPI signals (bottom) as indicated. Pseudocolored cells depicting the cross-sectional area of individual cardiomyocytes. (I) Quantification of cardiomyocyte cross-sectional area in non-Tg (n=1996 total cardiomyocytes from 3 animals) and cmlc2:GdnEct2 (n=688 total cardiomyocytes from 5 animals). Mean values and standard deviations are shown in red. ****, P<1·10-15, Mann-Whitney test. Scale bars: 25 μm (A-B, D-E) 100 μm (G-H), 50 μm (magnifications from G and H).
Reprinted from Developmental Cell, 44, González-Rosa, J.M., Sharpe, M., Field, D., Soonpaa, M.H., Field, L.J., Burns, C.E., Burns, C.G., Myocardial Polyploidization Creates a Barrier to Heart Regeneration in Zebrafish, 433-446.e7, Copyright (2018) with permission from Elsevier. Full text @ Dev. Cell