
|
Fig. S1
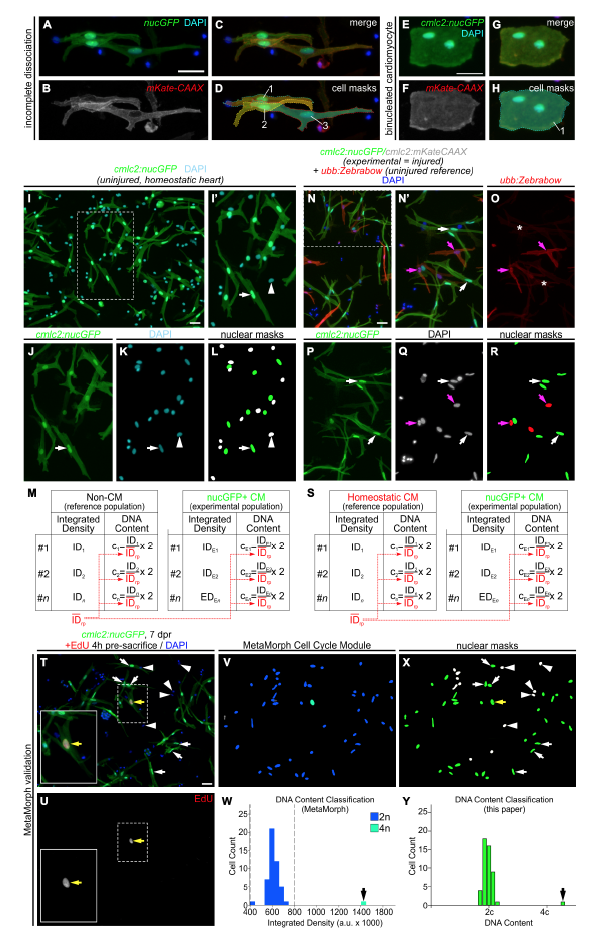
Quantitative strategies to measure cardiomyocyte nucleation and relative DNA content, Related to Figure 1 and STAR Methods. (A-H) Double transgenic reporters allow myocardial cell aggregates to be distinguished from binucleated cardiomyocytes.Fluorescent images of cardiomyocytes dissociated from double transgenic Tg(cmlc2:nucGFP; cmlc2:mKate-CAAX) hearts. Myocardial cell aggregates (A-D) can be clearly distinguished from binucleated cardiomyocytes (E-H). (A,E) Fluorescent images showing overlapping nuclear GFP and DAPI signals. (B,F) Flourescent images showing membrane localized mKate signal. (C,G) Merged images of (A,B) and (E,F), respectively. (D,H) Pseudocolored masks based on mKate-CAAX signal highlight cell contours revealing the presence of either three mononucleated cardiomyocytes (D) or a binucleated primordial cardiomyocyte (H). (I-M) Strategy used to quantify DNA content in cardiomyocytes from homeostatic hearts using non-myocardial cells as the diploid reference population. (I) Representative image of cells from dissociated Tg(cmlc2:nucGFP) ventricles (as shown in Figure 1B), showing GFP and DAPI signals. (I’) Magnification of boxed area in (I). Cardiomyocytes are GFP+ rod-shaped cells with bright nuclei (white arrow). Non-myocardial cells (i.e. fibroblasts, epicardial and endocardial cells) are GFP- (white arrowhead). (J,K) Individual fluorescent channels showing GFP and DAPI signals. (L) Nuclear masks were generated based on DAPI signal. Cardiomyocyte and non-cardiomyocyte nuclear masks appear in green and white, respectively. (M) For each nucleus, the integrated density (ID) of the DAPI signal was obtained. The average ID value of noncardiomyocytes (reference population, IDrp, red) was determined for every picture. This value represents the average DNA content of the diploid population (2c). Then, the ID value of each cell from both populations was divided by the IDrp and multiplied by 2. The resulting value represents the DNA content of a given cell relative to the reference population. See STAR Methods section for further details. (N-S) Strategy used to quantify DNA content in cardiomyocytes from regenerating hearts using homeostatic cardiomyocytes as the reference diploid population. Double transgenic Tg(cmlc2:nucGFP; cmlc2:mKate-CAAX) animals were subjected to apical resection. Because polyploidization of non-myocardial cells from amputated hearts cannot be ruled out, injured ventricles were dissociated in combination with uninjured ventricles from Tg(ubb:Zebrabow) animals, that express mCherry in all cells. mCherry+ ubb:Zebrabow cardiomyocytes were used as the reference diploid population. (N) Representative image of cells from dissociated injured Tg(cmlc2:nucGFP; cmlc2:mKate-CAAX) and uninjured Tg(ubb:Zebrabow) ventricles, showing mCherry, GFP and DAPI signals. (N’) Magnification of boxed area in (N). Cardiomyocytes from regenerating hearts are nucGFP+ (white arrows) and cardiomyocytes from homeostatic hearts are mCherry+ (pink arrows). (OQ) Individual fluorescent channels showing mCherry, GFP, and DAPI signals. Asterisks in (O) indicate faint signal from mKate-CAAX in regenerating cardiomyocytes. (R) Nuclear masks were generated based on DAPI signal. Regenerating cardiomyocyte and homeostatic cardiomyocyte nuclear masks appear in green and red, respectively. (S) For each nucleus, the ID of the DAPI signal was obtained. The average ID value of the mCherry+ reference population (IDrp, red) was determined for every picture. This value represents the average DNA content of the diploid population (2c). Then, the ID value of each cell was divided by the IDrp and multiplied by 2. The resulting value represents the DNA content of a given cell relative to the reference diploid population. (T-Y) Validation of our quantification strategy using the MetaMorph Cell Cycle Module. (T) Representative image of dissociated cells from Tg(cmlc2:nucGFP) ventricles at 7 days post-resection. Animals were injected with 10 μM EdU 4 hours before dissociation to label proliferating cells. (U) Individual fluorescent channels showing EdU signal. Boxed areas are shown at higher magnification. Yellow arrow indicates an EdU+ cardiomyocyte nucleus. (V-W) Ploidy measurement of image shown in (T) using MetaMorph software. (V) Color-coded masks automatically generated by the MetaMorph Cell Cycle Module based on DAPI integrated density. (W) DNA content histogram generated by MetaMorph. The software identified a cell with double the DNA content compared to the rest of the population (black arrow). (X,Y) Ploidy measurement of image shown in (T) using the quantification strategy described above. (X) Nuclear masks generated manually based on DAPI signal. Cardiomyocyte and non-cardiomyocyte nuclear masks appear in green and white, respectively. (Y) DNA content histogram generated by the quantification strategy described above. This method identified a cell with double the DNA content compared to the rest of the population (black arrow). Scale bars: 50 μm.
Reprinted from Developmental Cell, 44, González-Rosa, J.M., Sharpe, M., Field, D., Soonpaa, M.H., Field, L.J., Burns, C.E., Burns, C.G., Myocardial Polyploidization Creates a Barrier to Heart Regeneration in Zebrafish, 433-446.e7, Copyright (2018) with permission from Elsevier. Full text @ Dev. Cell