
|
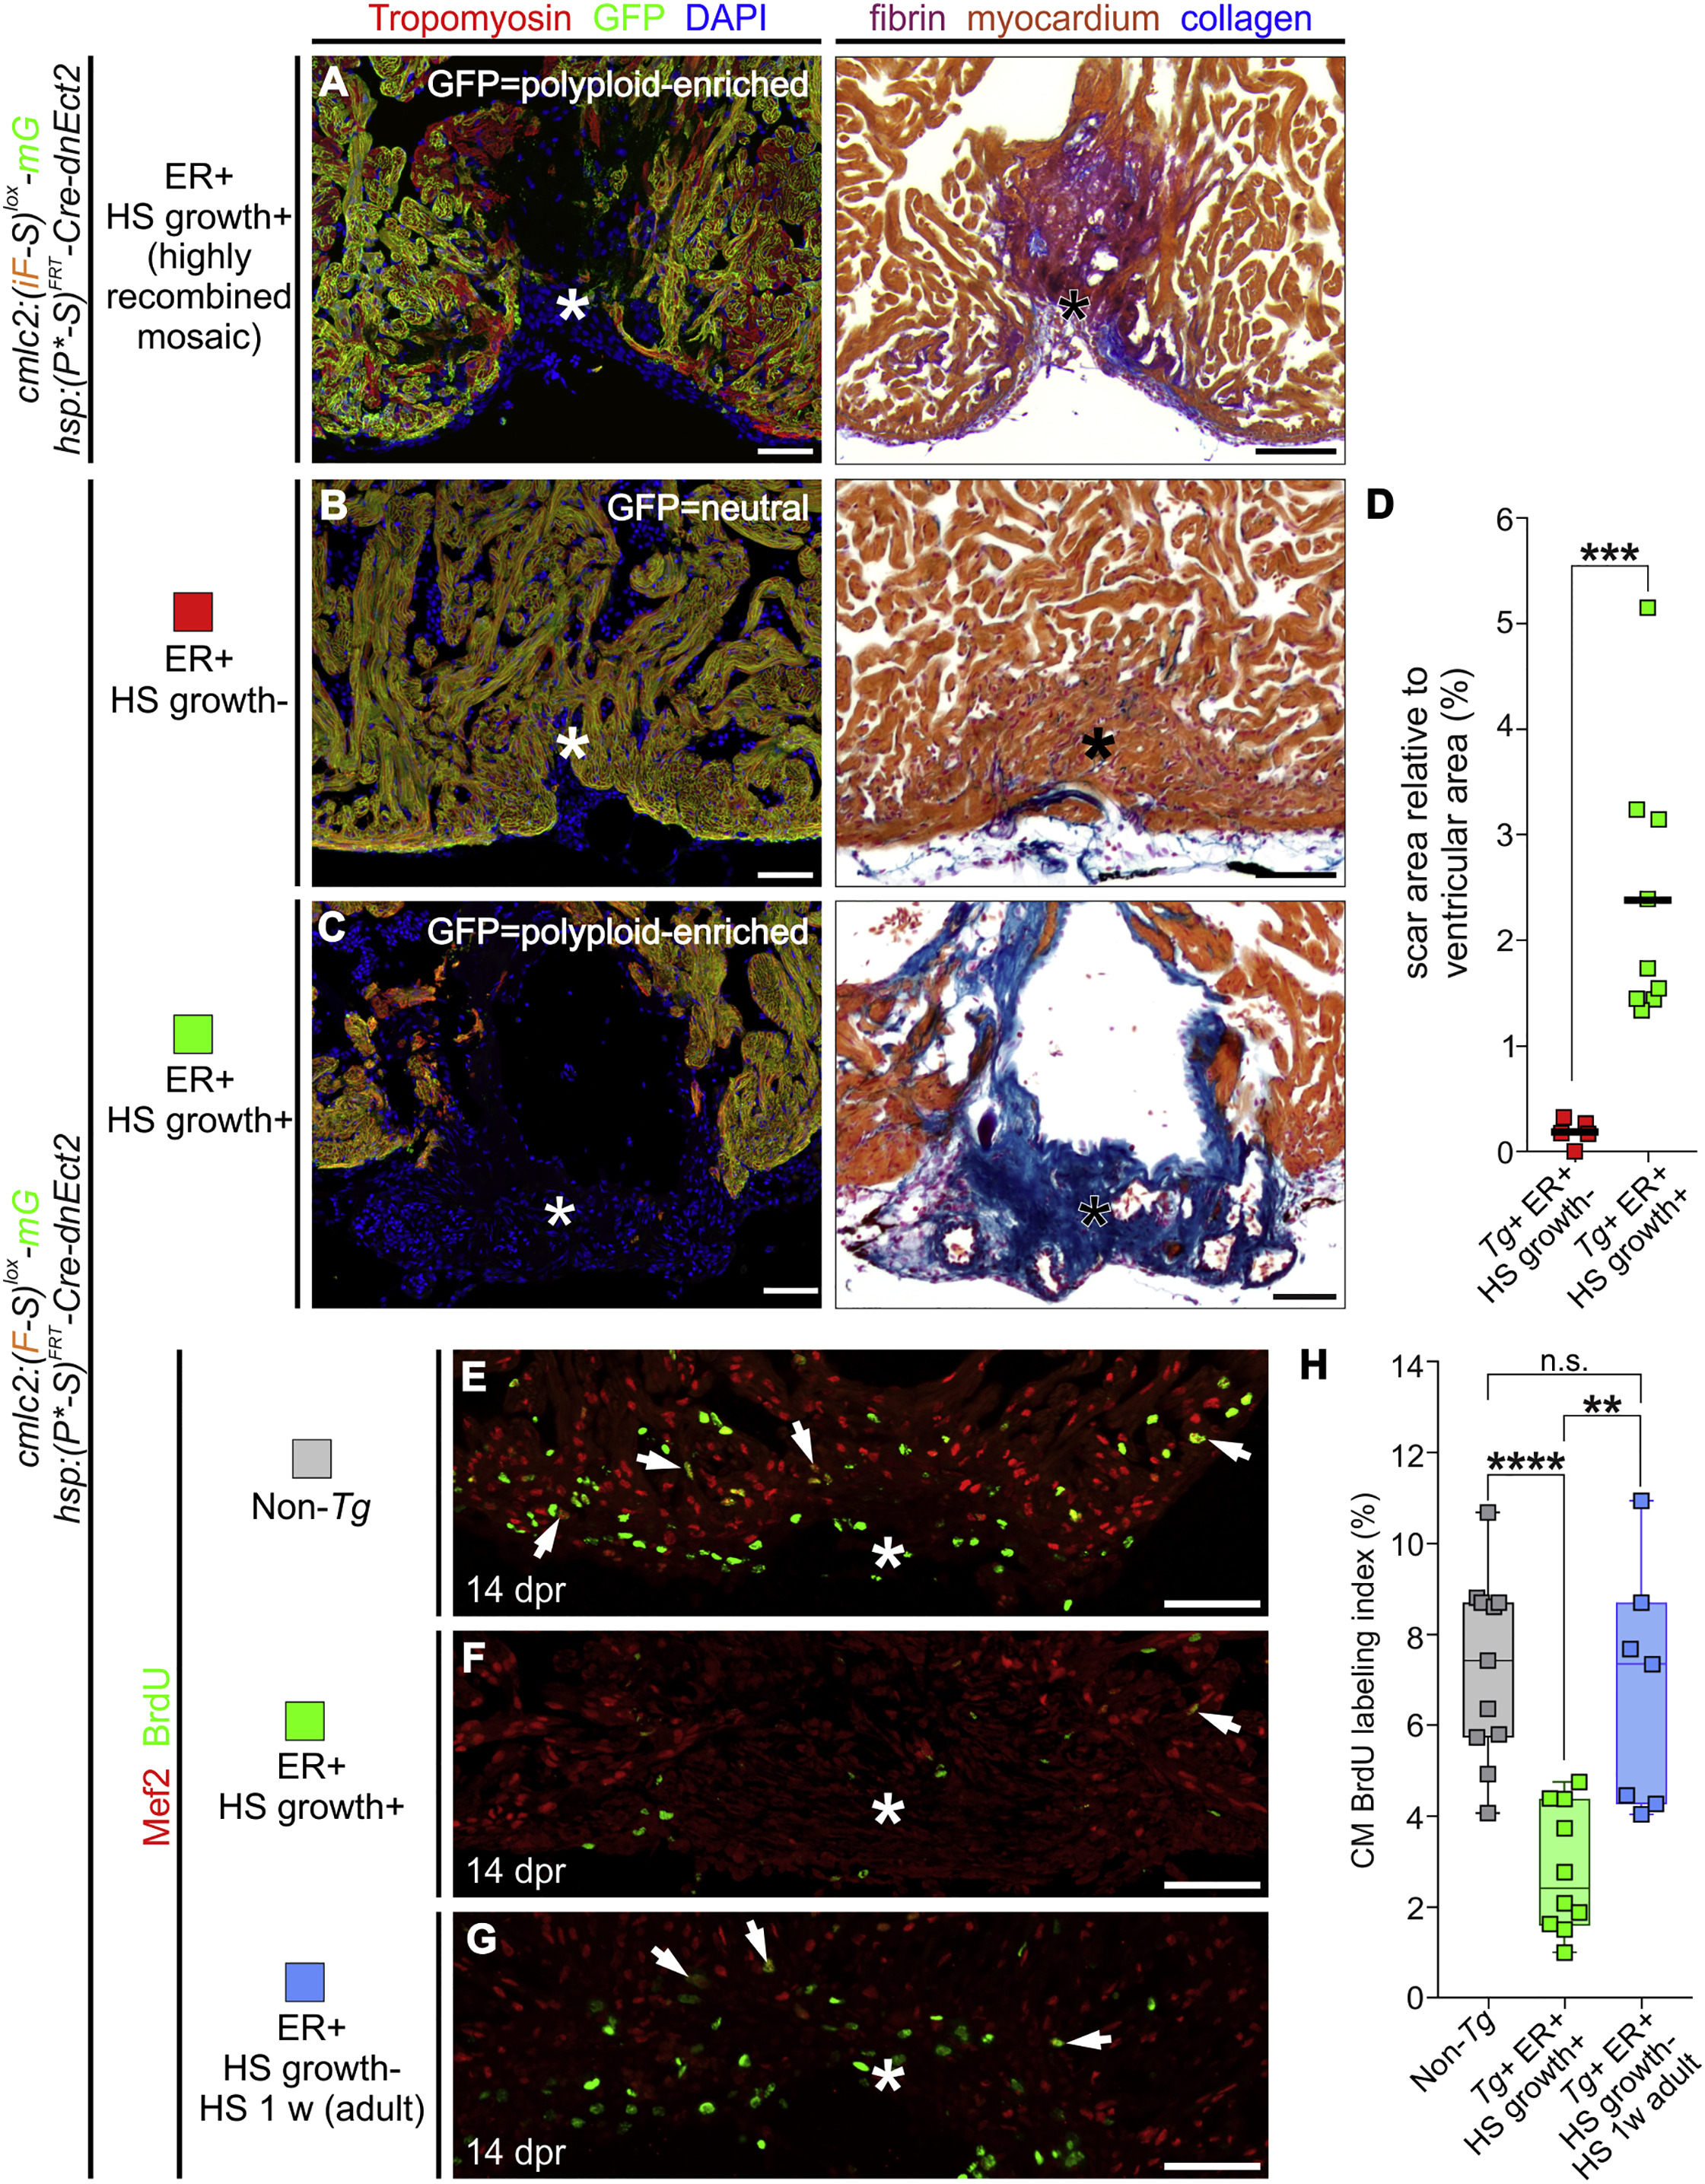
Fig. 6
Increasing the Proportion of Polyploid Cardiomyocytes Impairs Heart Regeneration
(A–C) Adjacent sections from 45-dpr hearts from the indicated cohorts, immunostained for tropomyosin and GFP (left) or stained with AFOG (right). n = 2 (0), 5 (5), and 9 (0) hearts (number of hearts that showed complete regeneration indicated in parentheses), respectively. Asterisks indicate injured/regenerated area.
(D) Quantification of the scar area of hearts from (B) and (C) normalized to the ventricular area (n = 5 and 9 hearts; solid black line indicates the mean); ∗∗∗p < 0.001, two-tailed unpaired t test.
(E–G) Sections from 14-dpr hearts of the indicated cohorts, immunostained for Mef2 and BrdU, as described in Figures 5G and 5H. White arrows indicate BrdU+ cardiomyocyte nuclei. Asterisks indicate injured/regenerated area.
(H) Cardiomyocyte BrdU labeling index in injury sites in experiments from (E) to (G). Box-and-whisker plot. n = 11, 10, and 7 ventricles, respectively. ∗∗∗∗p<0.0001; ∗∗p<0.01 by one-way ANOVA followed by Tukey's multiple comparisons test.
CM, cardiomyocyte; ER, early recombination; HS, heat-shocked. Scale bars, 50 μm. See also Figures S7 and S8.
Reprinted from Developmental Cell, 44, González-Rosa, J.M., Sharpe, M., Field, D., Soonpaa, M.H., Field, L.J., Burns, C.E., Burns, C.G., Myocardial Polyploidization Creates a Barrier to Heart Regeneration in Zebrafish, 433-446.e7, Copyright (2018) with permission from Elsevier. Full text @ Dev. Cell