
|
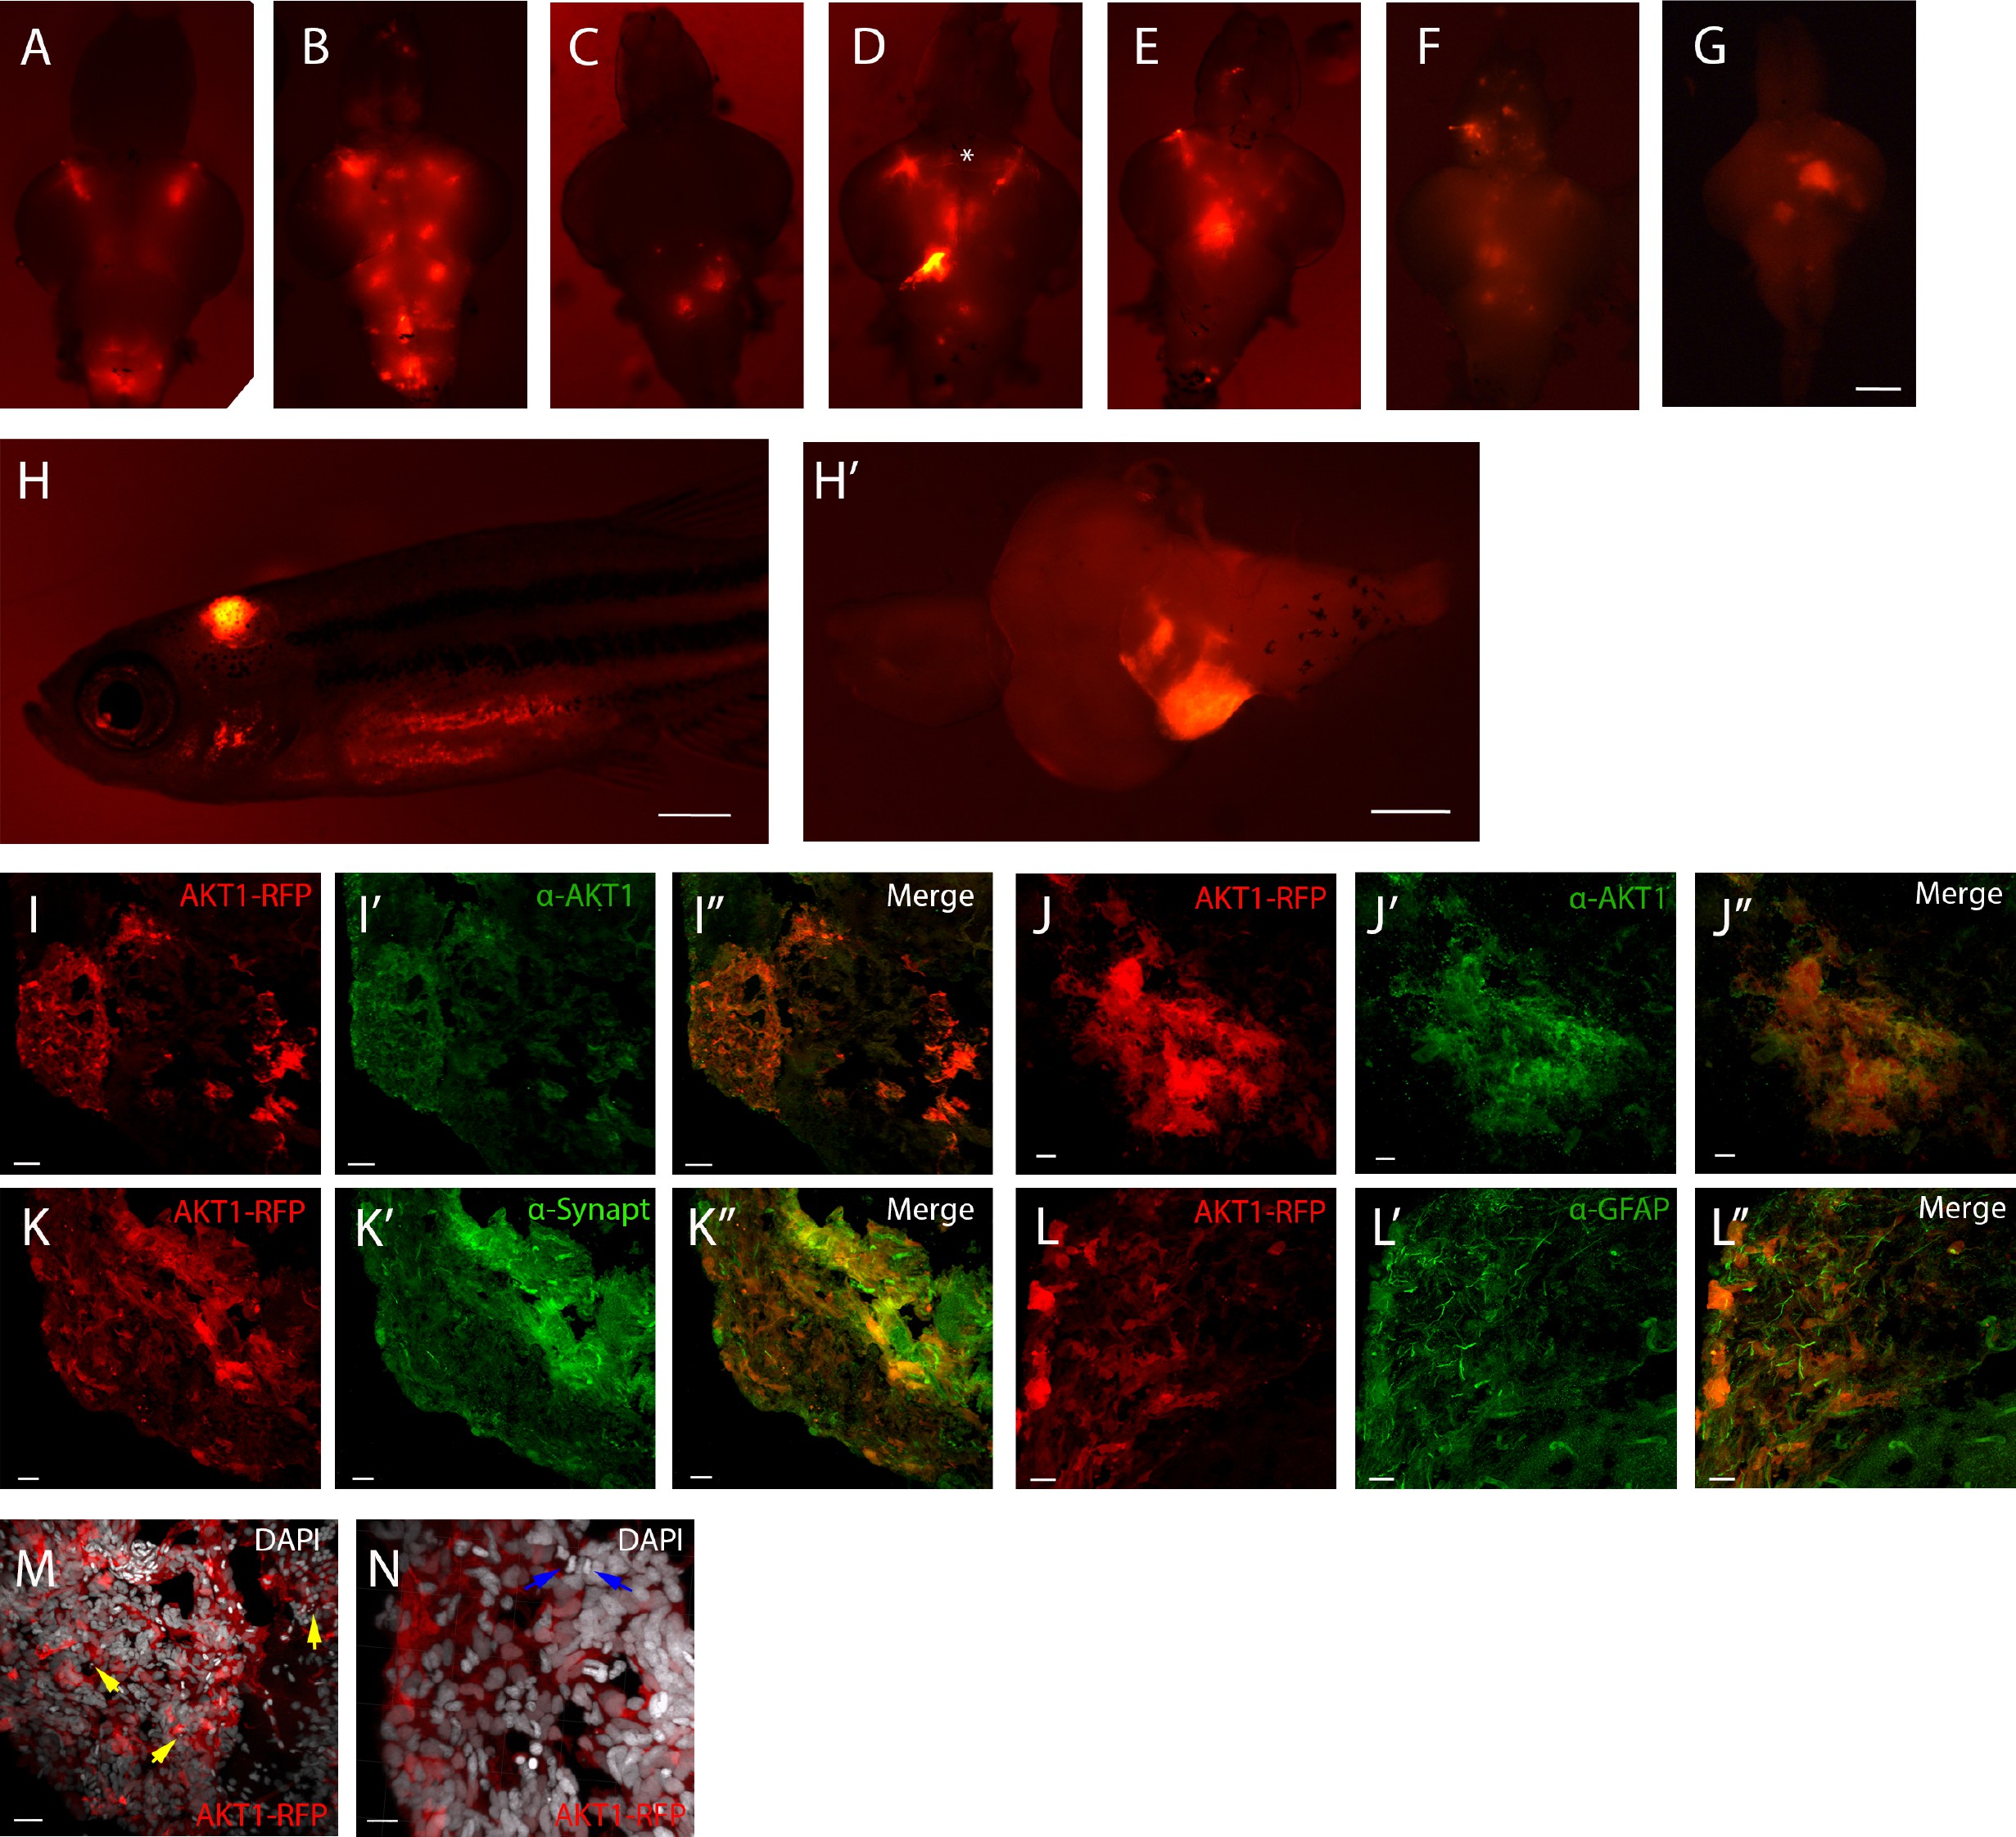
Fig. 1-S1
Neural AKT1 expression induces brain tumors with mixed neuronal and glial components.
(A)-(G) Representative brain samples from 1-month-old zebrafish injected with driver plasmid containing the NBT promoter (NBT:∆lexPR-lexOP-pA) together with a lexOP:AKT1-lexOP:tagRFP, showing clones of cells expressing the oncogene (red fluorescence). Some clones showed neuronal differentiation (axons, asterisk in D). (H), (H’) Example of a 1-month-old fish showing a large cerebellar clone of oncogene expressing cells. (I)-(N) Sections through the cerebellar tumor shown in (H’), showing red fluorescence from the transgene (I), (J), (K), (L), (M)-(N) and green fluorescence for immunohistochemistry for AKT1 (I’), (J’), Synaptophysin (K’) and GFAP (L’) or white nuclear staining (DAPI) (M), (N). Yellow arrows in (M) point to apoptotic bodies. Blue arrows in (N) point to mitotic figures. Scale bars represent: 100 µm for (A)-(G) and. (H’); 1 mm for (H); 50 µm for (I), (I’); 20 µm for (J)-(K’) and (M), (M’); 10 µm for (L), (L’) and (N).