
|
Fig. 5
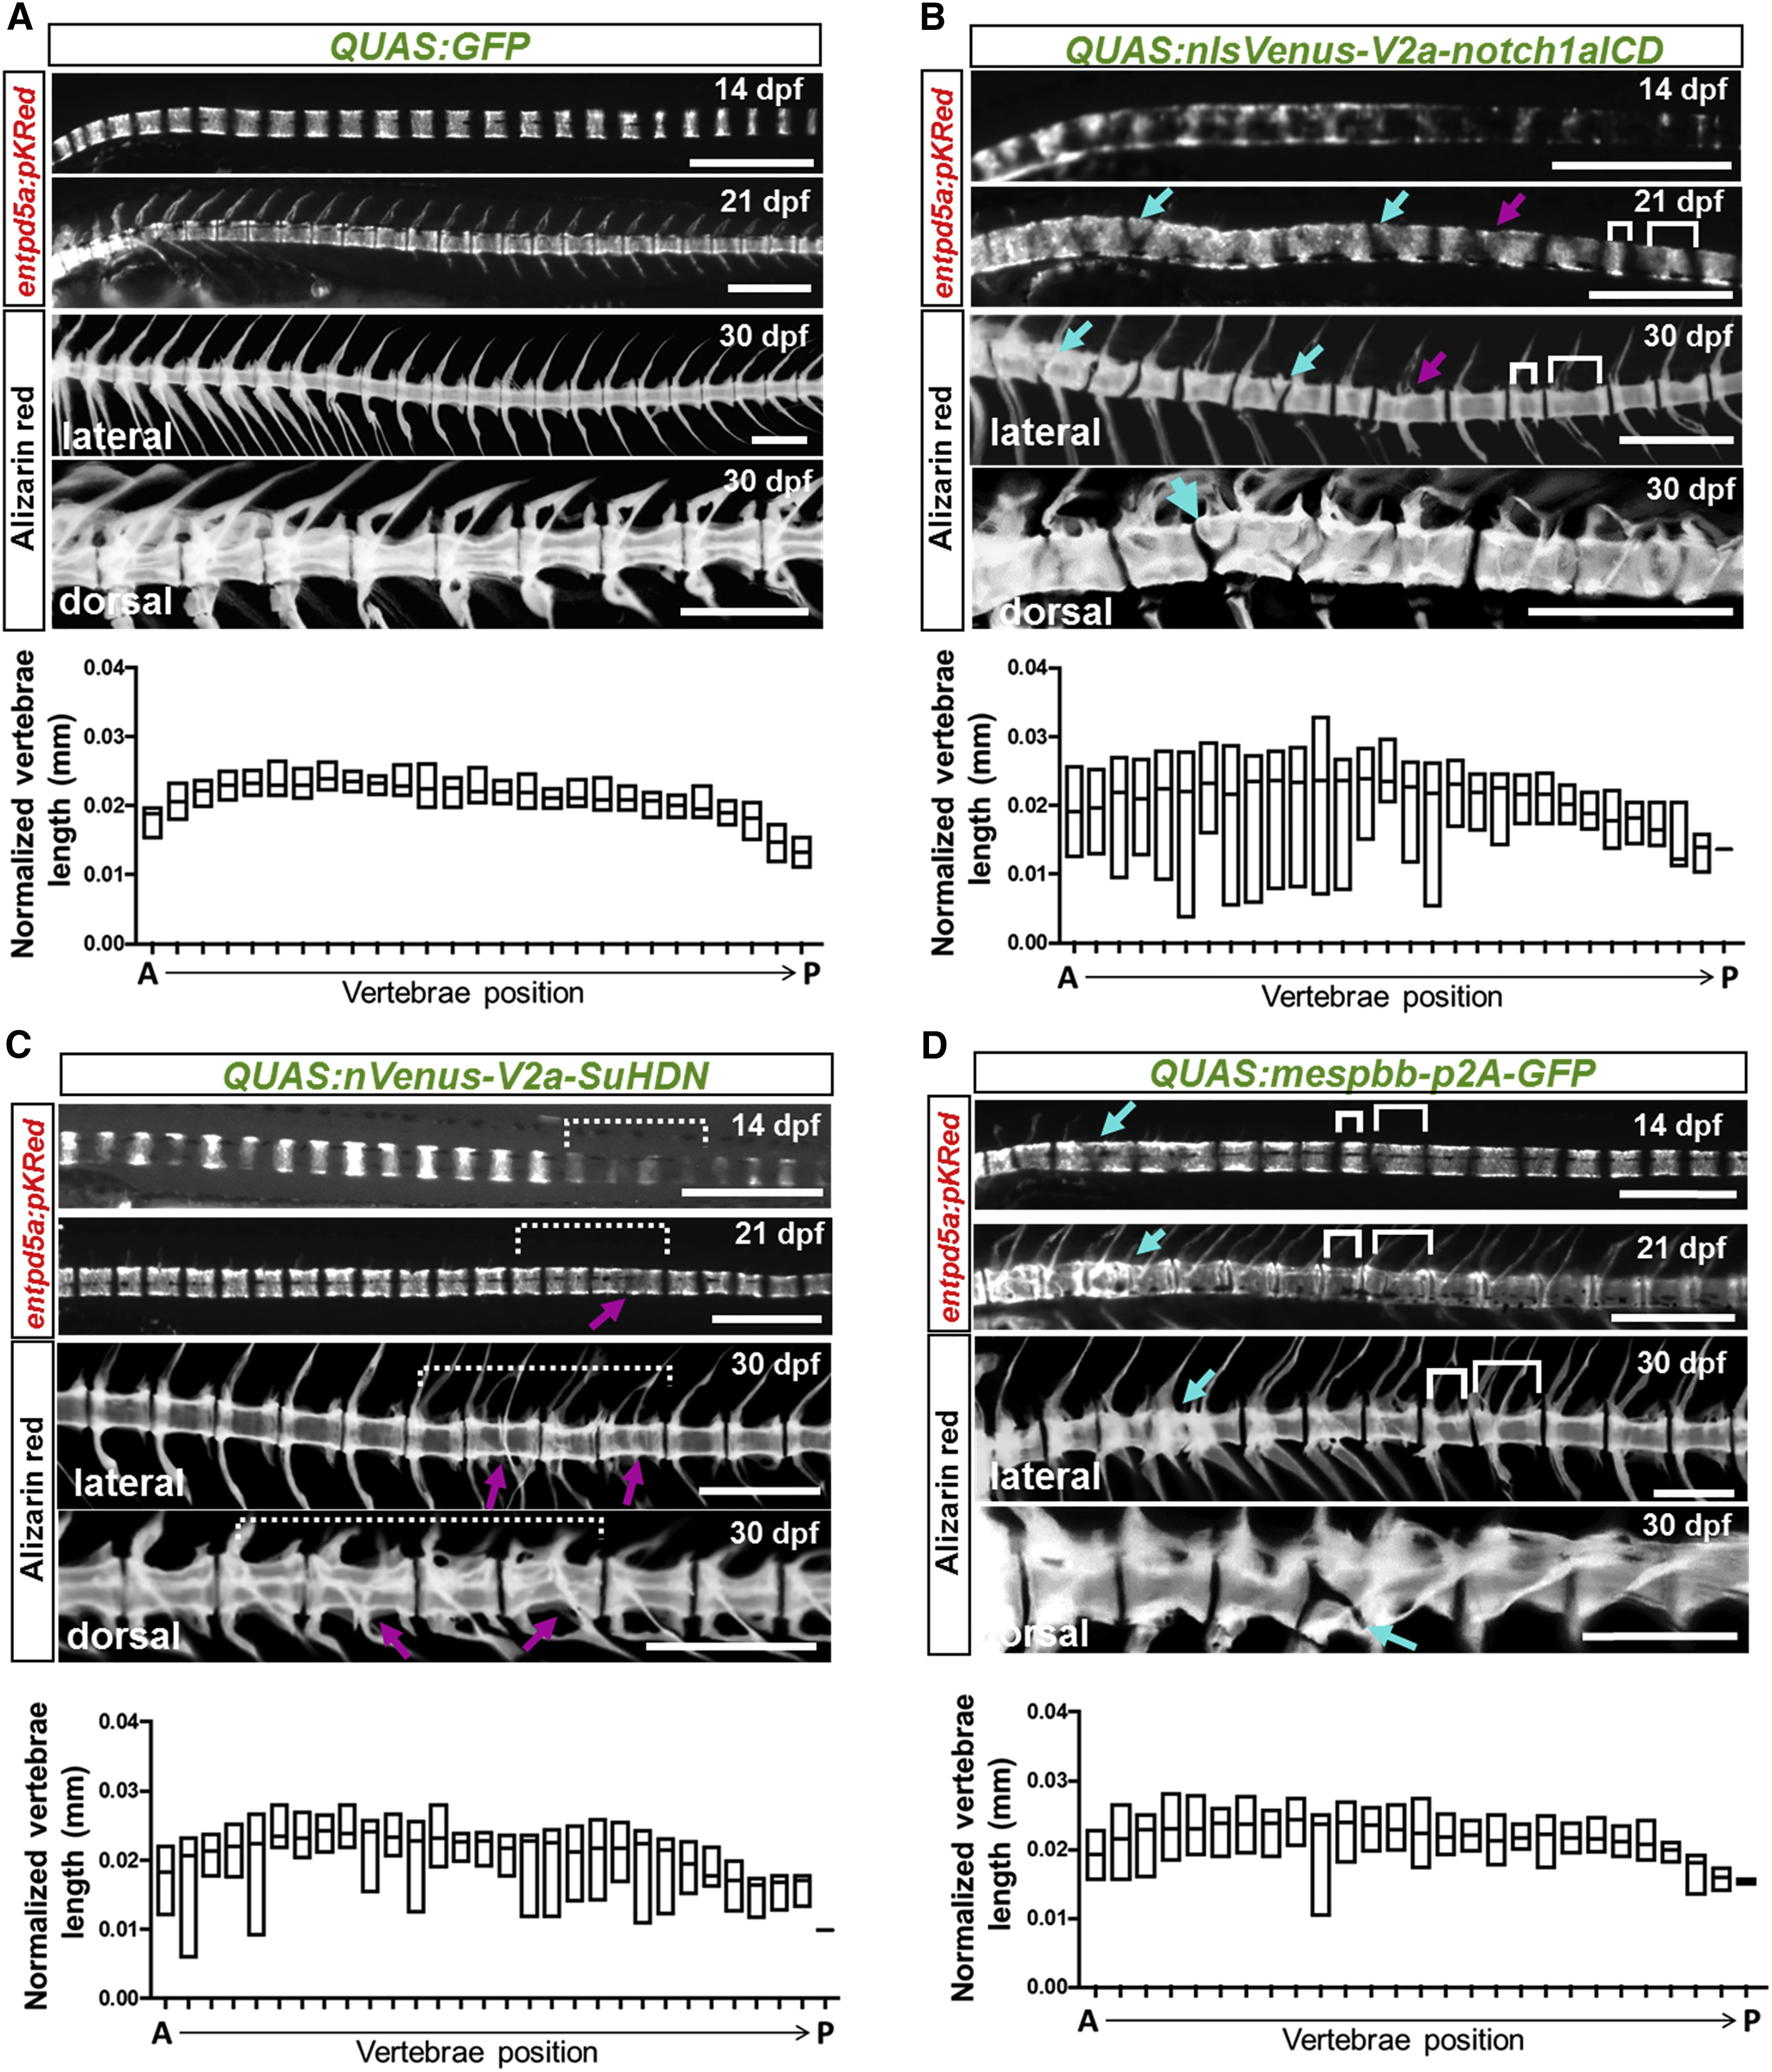
Alteration of Notochord Sheath Segmentation Produces Matching Defects in Spine Segmentation
(A) Bright-field imaging of entpd5a:pkRED expression in the notochord sheath using the QF2/QUAS system to overexpress GFP does not alter segmentation. Vertebrae length measurements in 30 dpf fish were normalized to standard length (n = 19).
(B) Constitutive activation of Notch signaling via expression of QUAS:nlsVenus-V2a-notch1aICD within the notochord sheath generates patchy entpd5a:pkRED segments at 14 dpf. At 21 dpf, some mature notochord segments are wedged, incomplete (cyan arrows), or irregularly sized (magenta arrows). Alizarin red staining revealed the same defects in the spine. Quantification of vertebra length normalized to the standard length showed highly variable size, particularly in the anterior portion of the spine, significantly deviating from the GFP control (n = 20, p = 0.0001).
(C) Inhibition of Notch signaling via expression of QUAS:nVenus-V2a-SuHDN resulted in partial or skipped entpd5a:pkRED segments producing gaps in the posterior region of the notochord at 14 dpf (dotted bracket). At 21 dpf, smaller entpd5a segments (magenta arrows) fill in gaps. Alizarin staining shows that these defects resulted in irregular spacing and fusions of vertebrae (magenta arrows). Measurements of vertebra length normalized to standard length showed irregularly sized vertebrae, particularly in the posterior portion of the spine, but the majority of these measurements did not differ significantly from the GFP control (n = 16).
(D) Misexpression of mespbb generates partial (cyan arrow) and variably sized segments (brackets) at 14 dpf. The same defects were observed at 21 and 30 dpf in the mature spine at the same positions. Vertebrae length measurements showed high variability throughout the spine axis, significantly different from the GFP control (n = 22, p = 0.0104). Onset and level of mespbb misexpression were attenuated by injection of QS mRNA.
Scale bars are 500 μm. Vertebrae position started with the first rib-bearing vertebra to the last caudal vertebra. We did not include the Weberian apparatus or the tail vertebrae in our analysis. The p values for vertebrae length comparisons were calculated from a one-way ANOVA with Dunnett’s multiple-comparisons test. Skeletal preps were converted to black-and-white images and inverted to better highlight defects. Floating bars in graphs display the minimum and maximum range for normalized vertebrae length (mm). Lines denote median values.
See also Figures S4–S6.