
|
Fig. 3
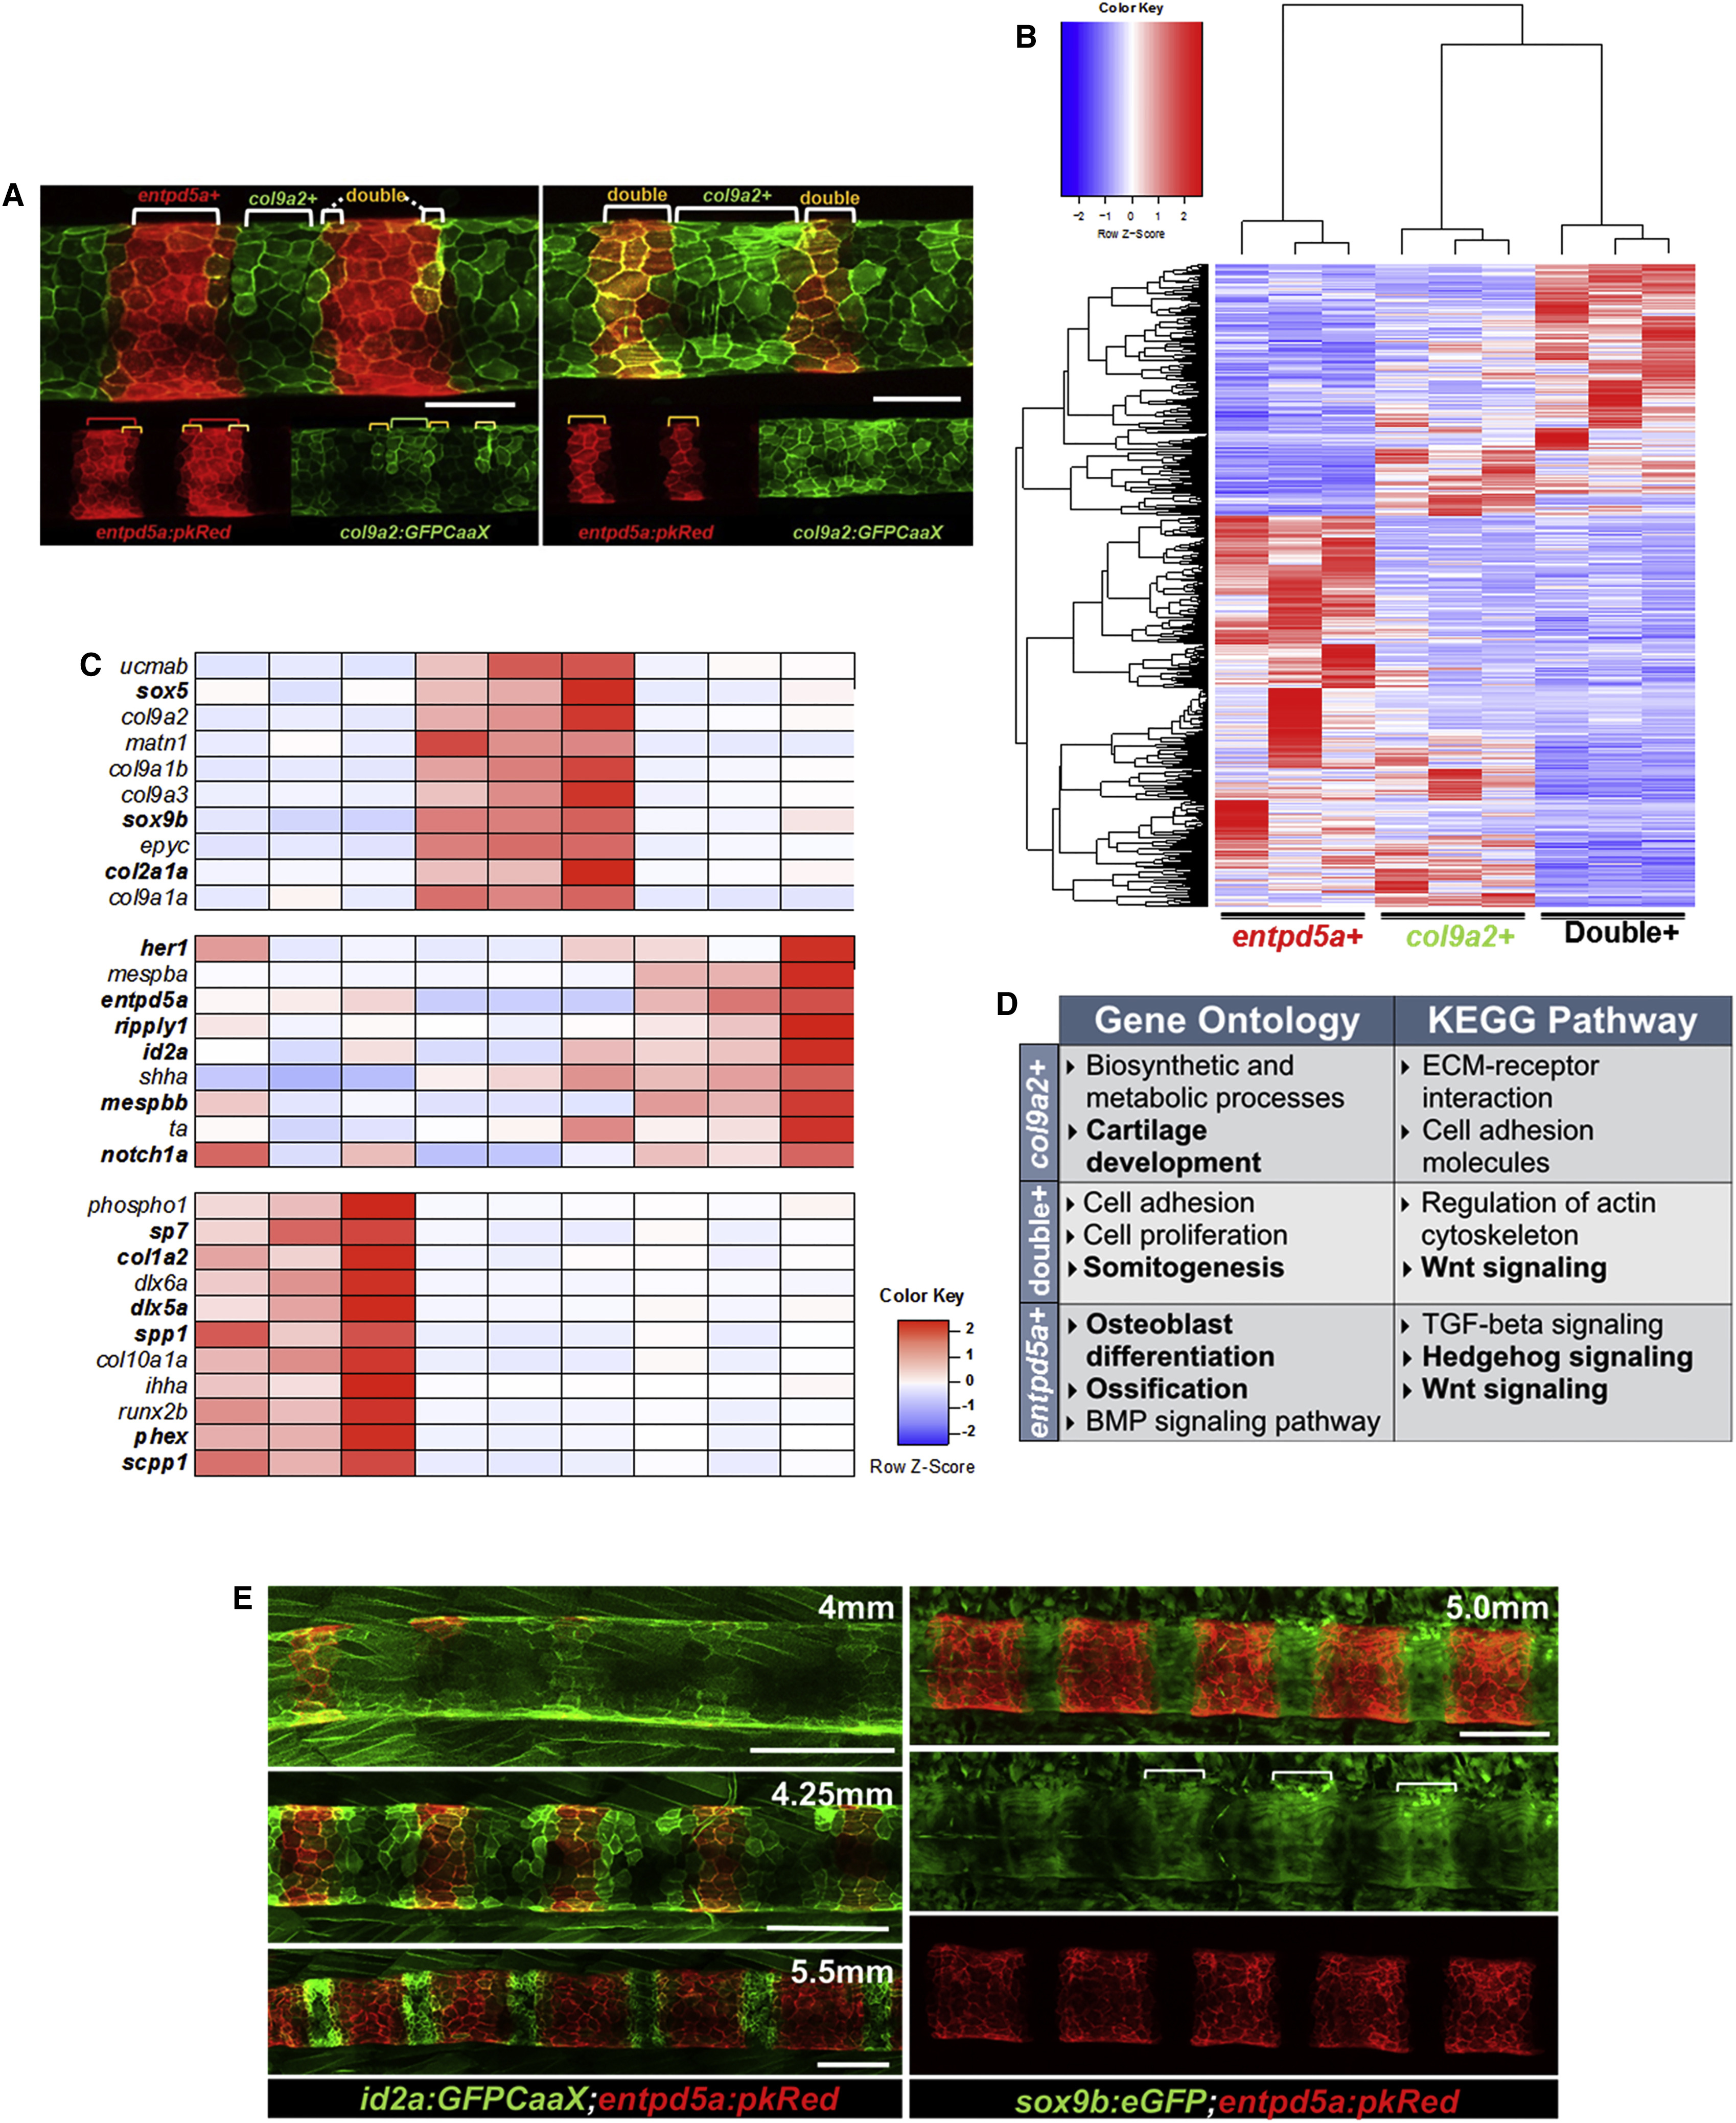
The Notochord Sheath Segments into Cartilage-like and Mineralizing Domains of Gene Expression
(A) Notochord sheath cells expressing col9a2:GFPCaaX and entpd5a:pkRED produce three cell populations: col9a2+ (green bracket), double-positive (yellow bracket), and entpd5a+ at 13 dpf or approximately 4.25 mm SL. In the same fish, mature or anterior segments express double-positive cells at borders between domains. New, more posterior segments consist of double-positive cells. Scale bar is 50 μm.
(B) Heatmap of differentially expressed genes (DEG) using scaled counts shows that the three cell populations possess distinctive clusters of upregulated genes. The color gradient indicates measures of SDs from the mean expression level of each gene.
(C) Heatmap visualization of genes within functionally annotated col9a2+, double-positive, and entpd5a+ populations show enrichment in genes linked to cartilage development, somite segmentation, and mineralization, respectively.
(D) Lists of top GO terms and KEGG pathways.
(E) Confocal imaging of transgenic reporter id2a:GFPCaaX shows dynamic expression in the notochord sheath specific to the double-positive domain. Imaging of sox9b:eGFP shows that expression in the notochord sheath is specific to the col9a2+ domain.
Developmental stages are based on standard length. Scale bars are 100 μm. Images in (A) and (E) are digitally stitched. See also Figures S2 and S3 and Tables S1 and S2.