
|
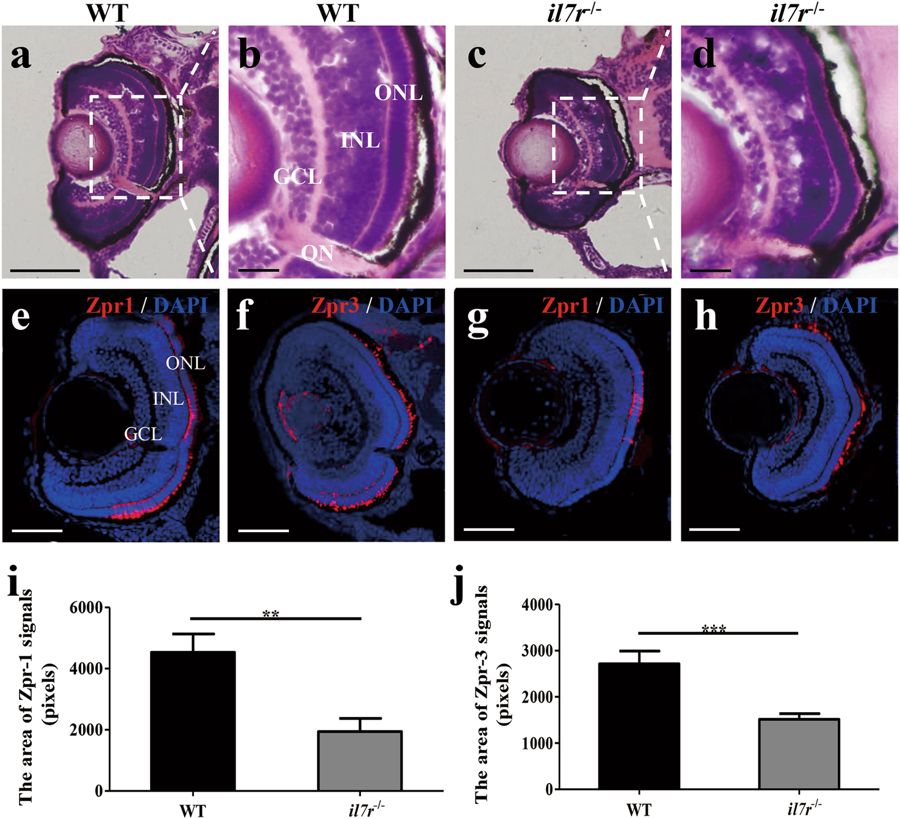
Fig. 5
Retinal development following il7r knockout.
a-d HE staining and magnified images of retinas from wild-type (WT, a and b) and il7r−/− (c and d) embryos at 72 hpf. e–h Images of Zpr1 or Zpr3 immunofluorescence staining of retinas in WT (e and f) and il7r−/− (g and h) embryos at 72 hpf. i-j Statistical analysis of Zpr1-positive signals (i) and Zpr3-positive signals (j) between WT and il7r−/− retinas. Note that the Zpr1-positive area (i) and Zpr3-positive area (j) are significantly decreased in il7r−/− retinas. Results are represented as means ± SEM (n = 10), **P < 0.01, ***P < 0.001. Scale bar: a and c, 40 μm; b and d, 10 μm; e–h, 50 μm. GCL ganglion cell layer, INL inner nuclear layer, ONL outer nuclear layer, ON optic nerve