
|
Fig. 5
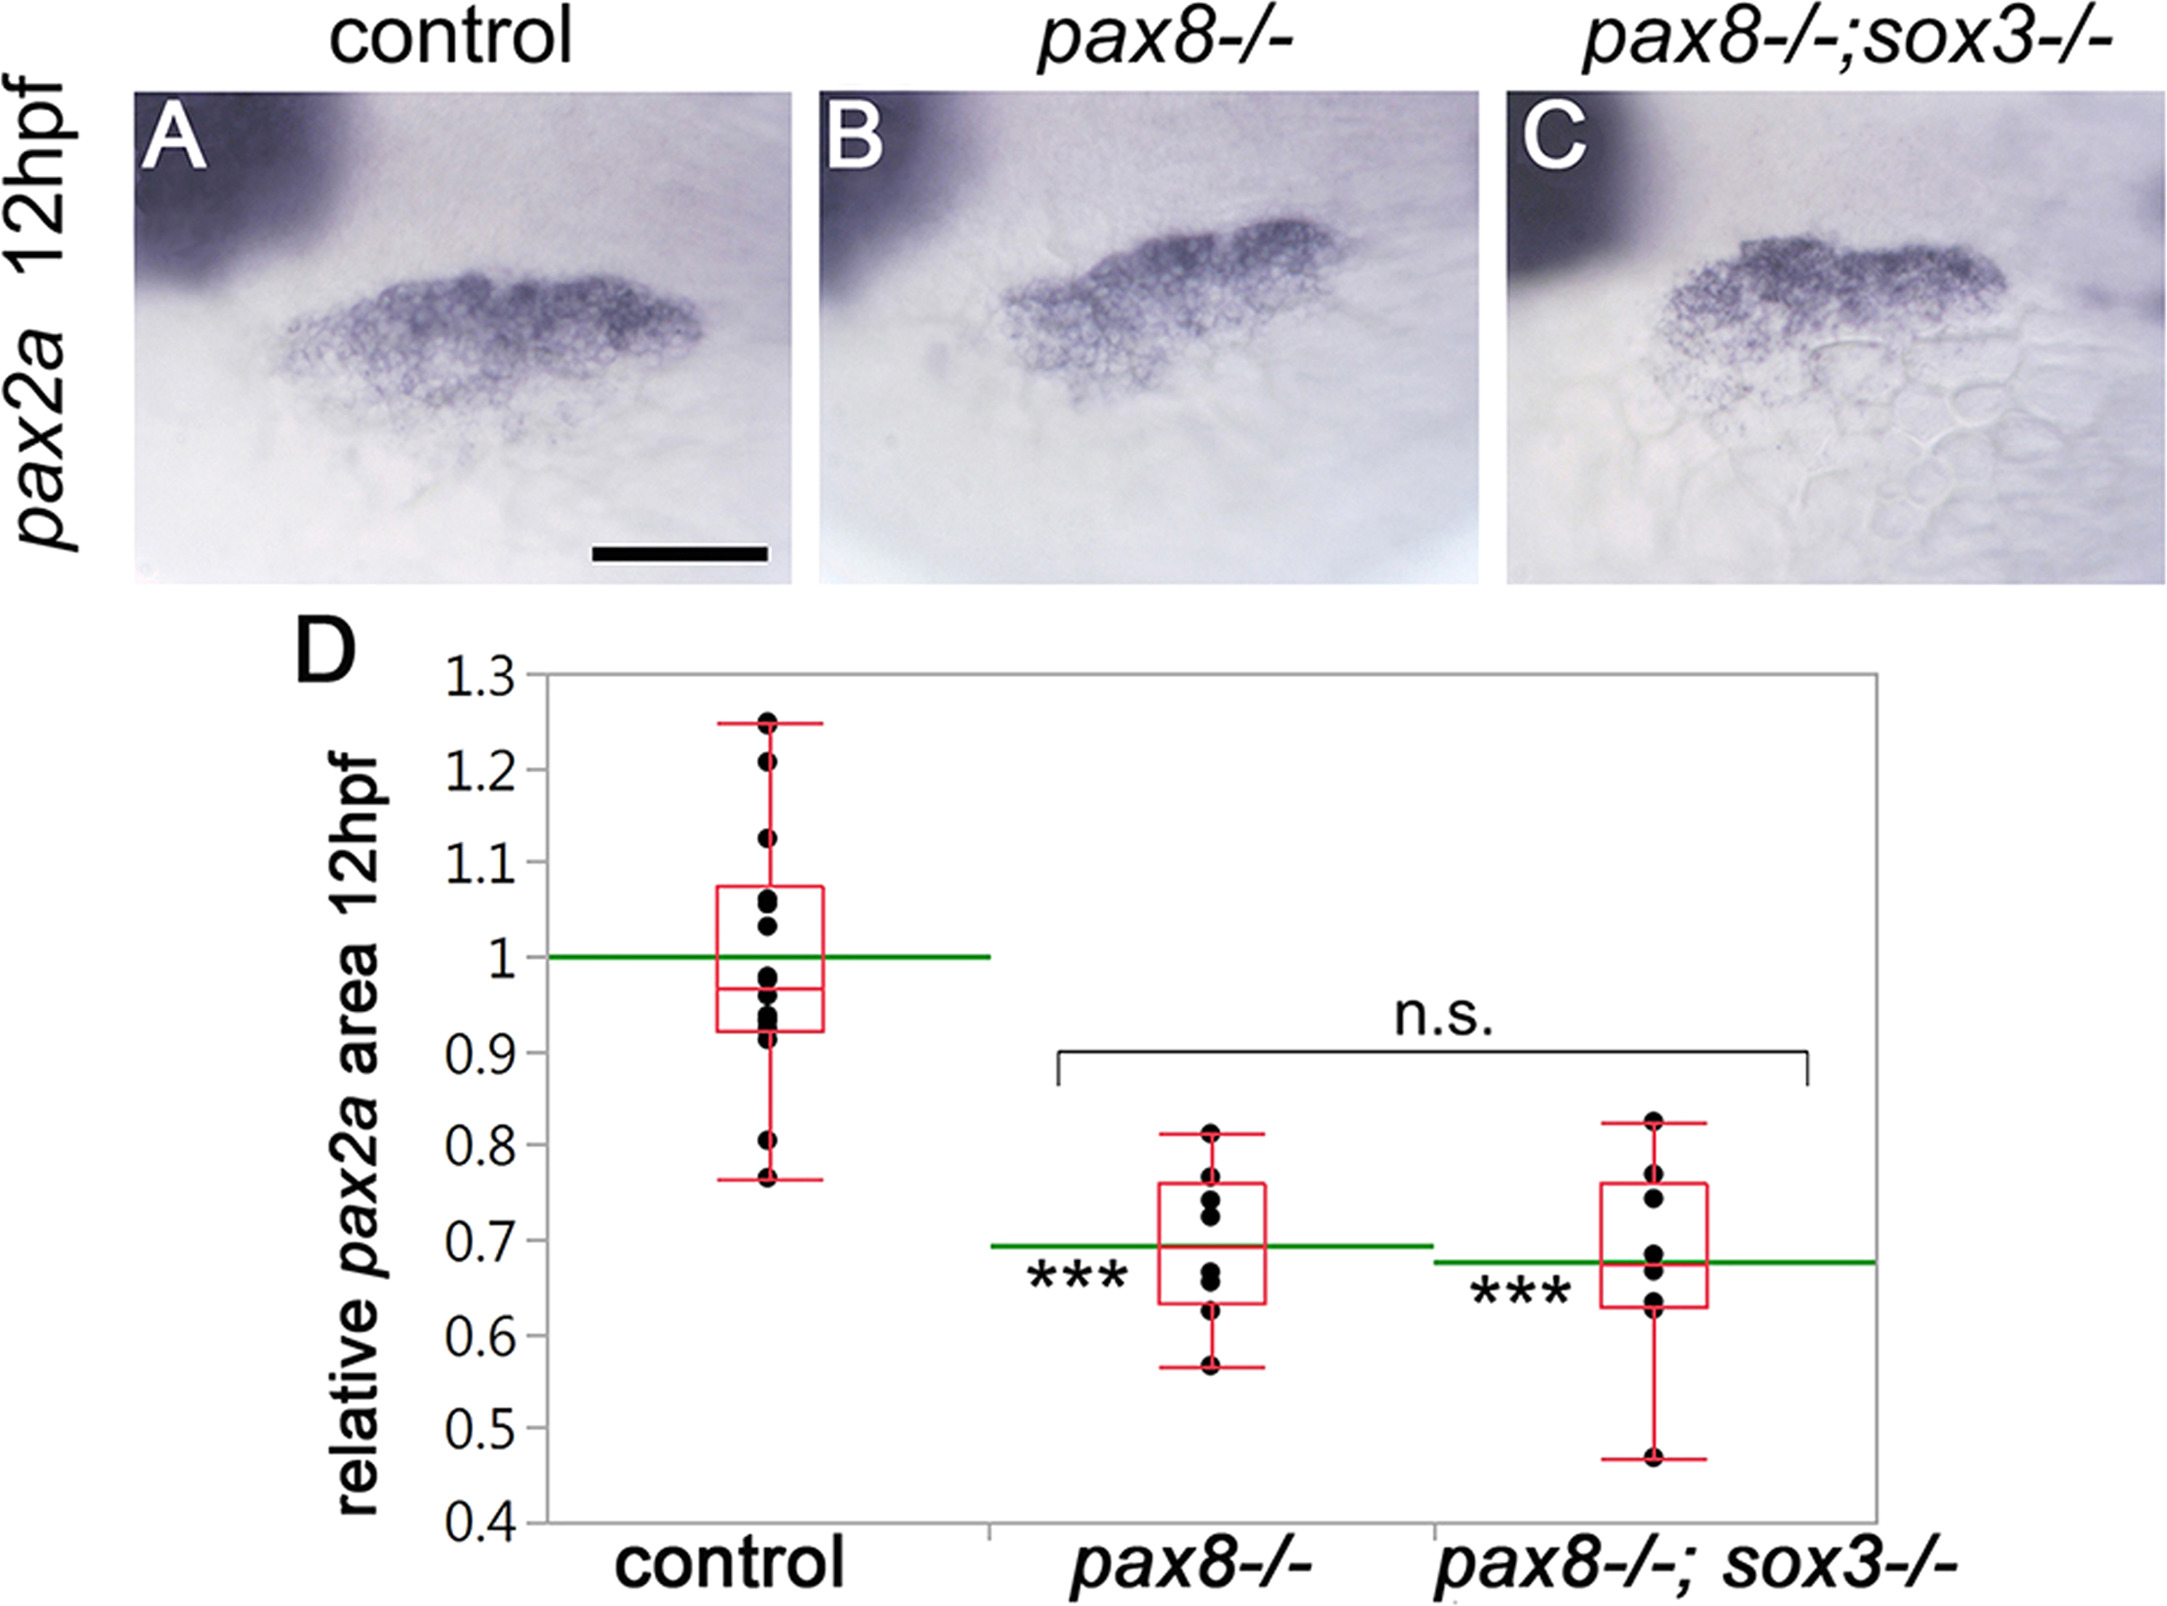
Interaction betweenpax8-/-andsox3-/-during early placode development. (A-C) Expression of pax2a at 12 hpf in a wild-type control embryo (A), a pax8-/- mutant (B) and a pax8-/-; sox3-/- double mutant (C) embryo. Dorsal-lateral view with anterior to the left. Scale bar, 50 µm. (D) Box-and-whisker plot of relative surface area of otic/epibranchial domain of pax2a at 12 hpf in control, pax8-/- and pax8-/-; sox3-/- double mutant embryos. Data are normalized relative to control groups, with means indicated by green lines. Asterisks indicate statistically significant differences relative to controls (*** P<0.001, Tukey's HSD test). n.s., not significantly different.
Reprinted from Developmental Biology, 435(1), Gou, Y., Guo, J., Maulding, K., Riley, B.B., sox2 and sox3 cooperate to regulate otic/epibranchial placode induction in zebrafish, 84-95, Copyright (2018) with permission from Elsevier. Full text @ Dev. Biol.