
|
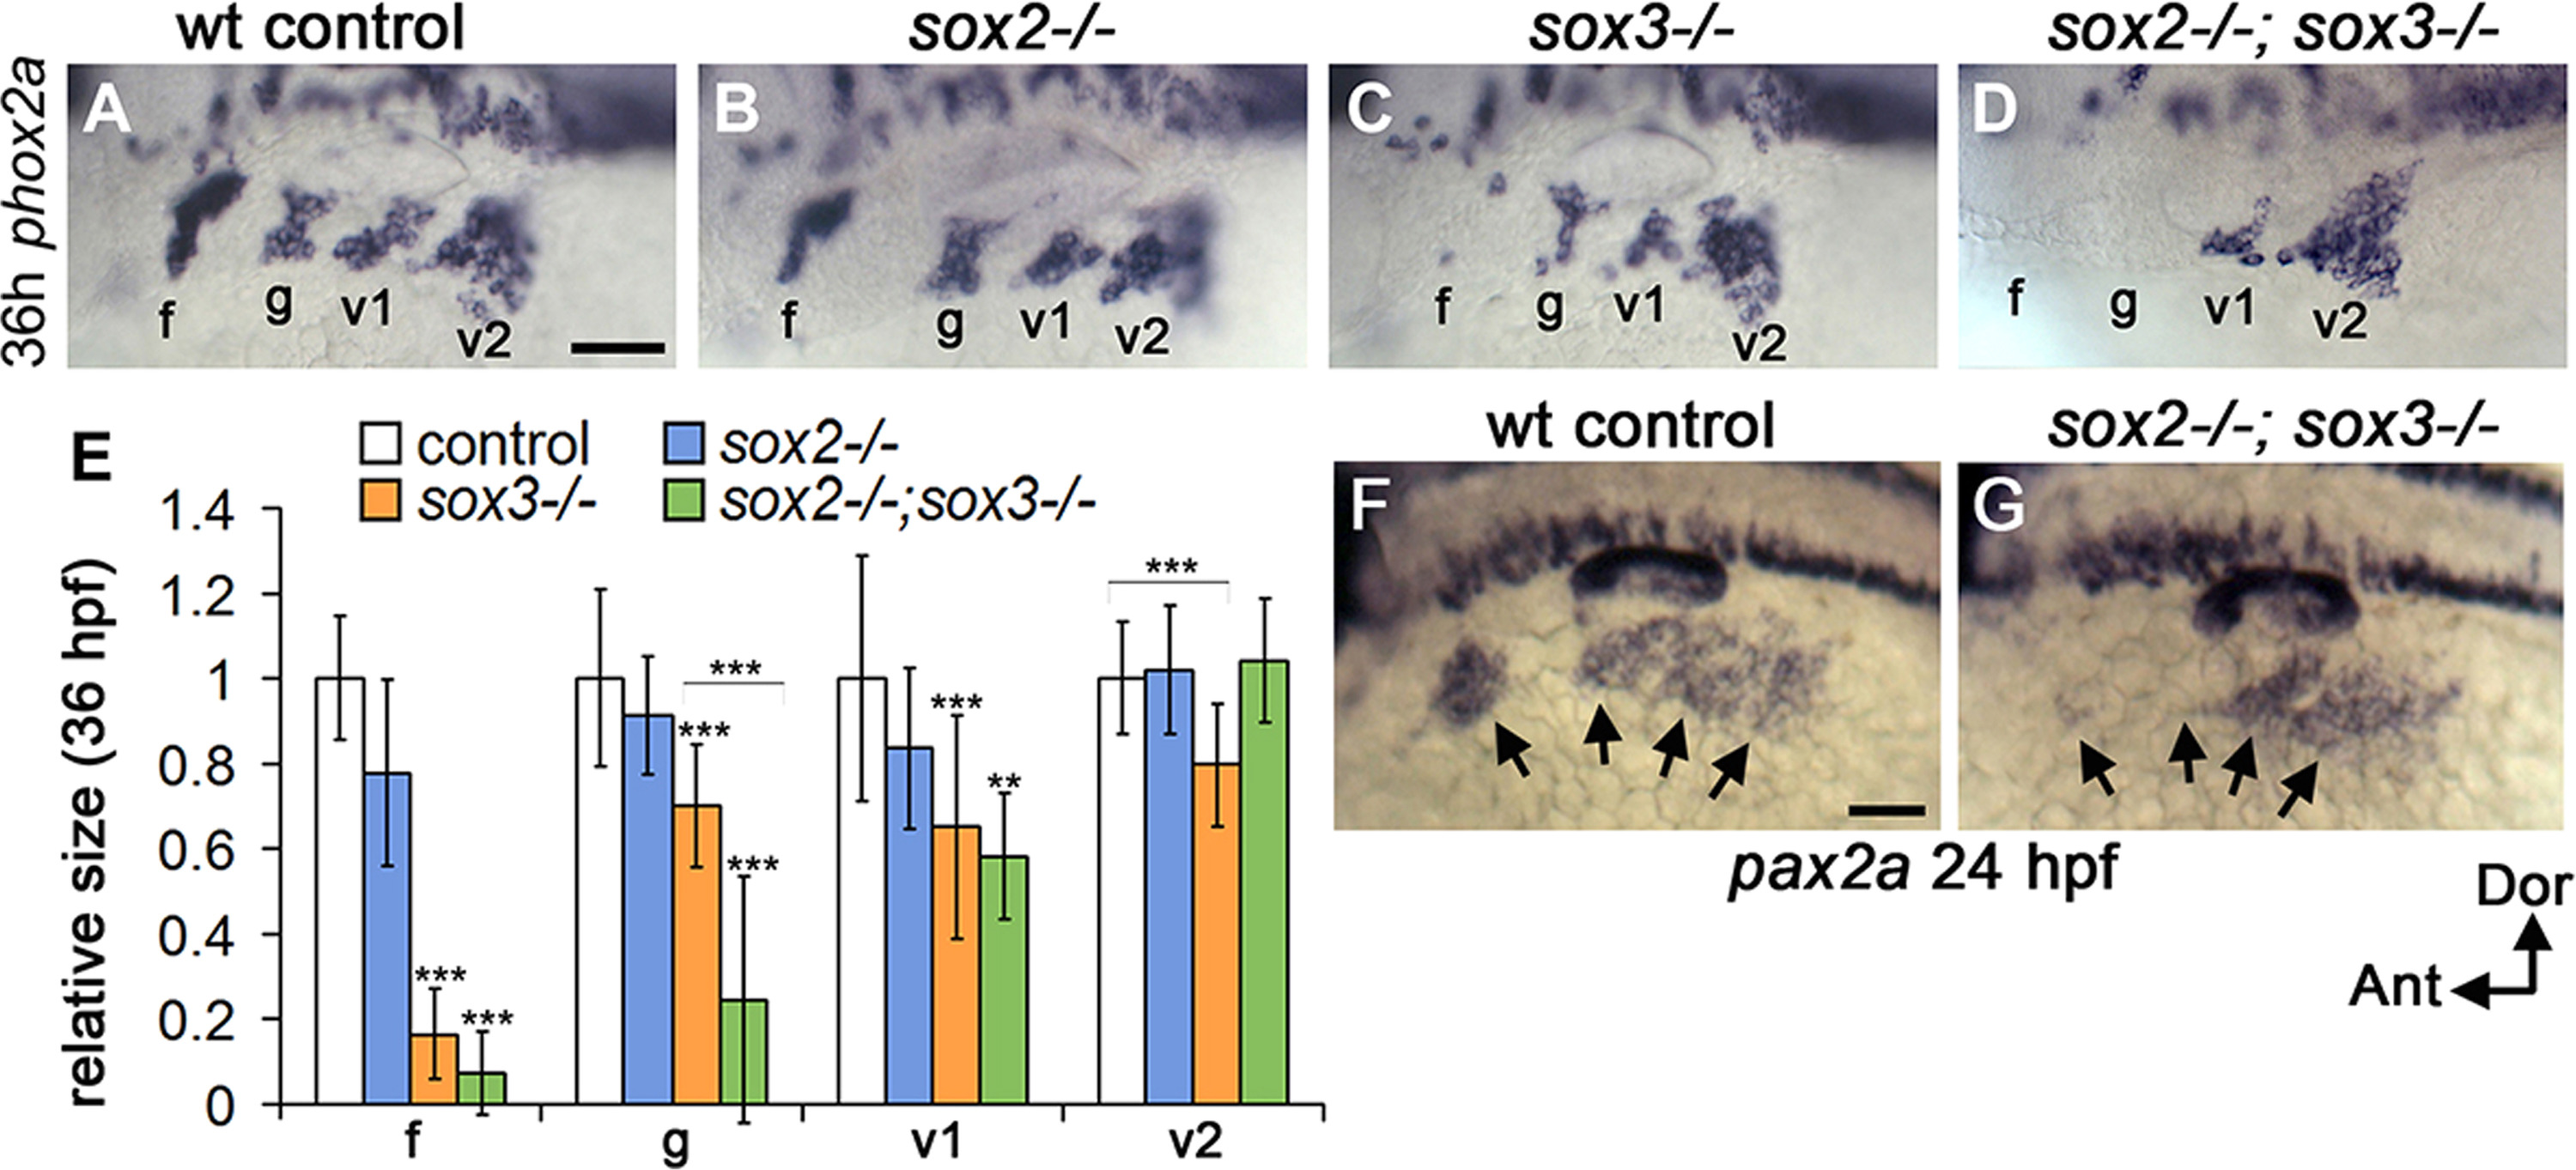
Fig. 4
Effect ofsox2-/-andsox3-/-on epibranchial ganglia. (A-D) Expression of phox2a at 36 hpf in a wild-type embryo (A), sox2 (B), sox3-/- (C) and sox2-/-; sox3-/- double mutant (D) embryo. Locations of the facial (f), glossopharyngeal (g), and vagal (v1 and v2) ganglia are indicated. Dorsal-lateral views with anterior to the left. (E) Quantitation of relative surface area of phox2a expression in individual epibranchial ganglia in control, sox2-/-, sox3-/- and sox2-/-; sox3-/- double mutant embryos. Data show means and standard deviations normalized to wild-type controls. Asterisks indicate statistically significant differences relative to controls (** P<0.01, *** P<0.001, Tukey's HSD test), or between non-control groups (bracket). (F, G) Dorsolateral views (anterior to left) showing expression of pax2a at 24 hpf in a control embryo (F) and sox2-/-; sox3-/- double mutant (G). Arrows indicate positions of epibranchial placodes. Scale bars, 50 µm.
Reprinted from Developmental Biology, 435(1), Gou, Y., Guo, J., Maulding, K., Riley, B.B., sox2 and sox3 cooperate to regulate otic/epibranchial placode induction in zebrafish, 84-95, Copyright (2018) with permission from Elsevier. Full text @ Dev. Biol.