
Image
|
Figure Caption
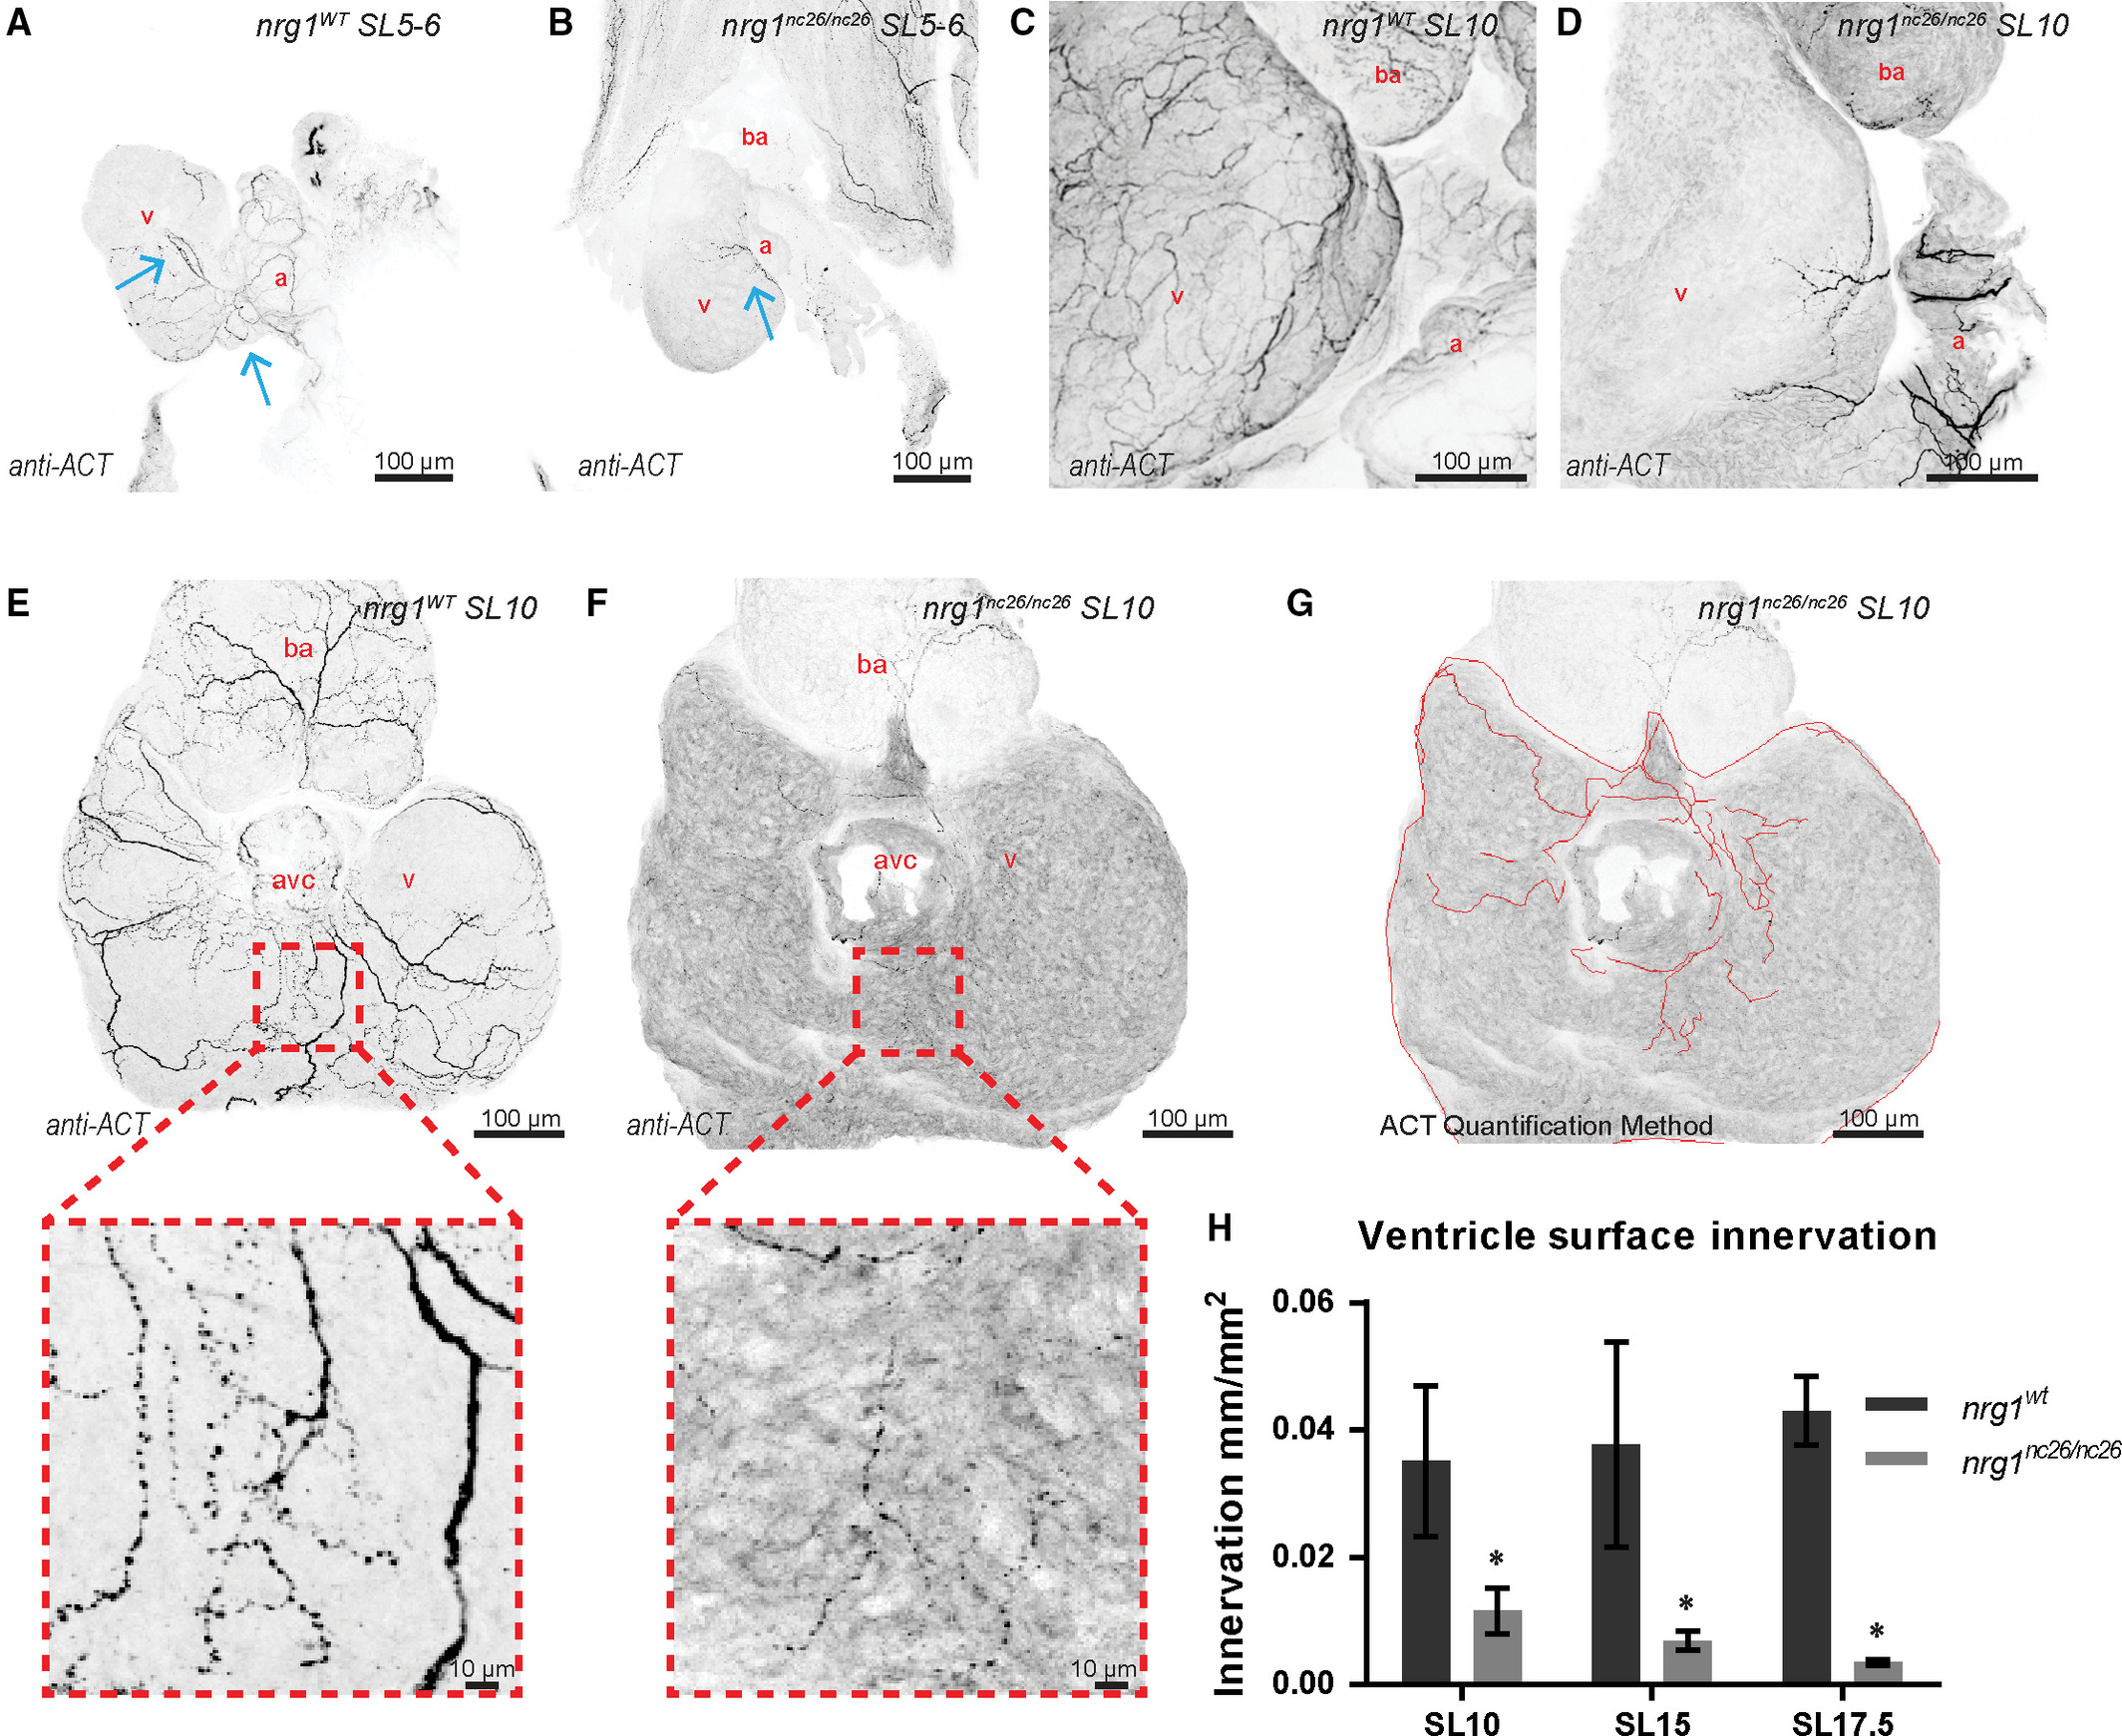
Fig. 4
Reduced ventricle surface innervation from juvenile to adult stages. (A–F) Representative z‐projections of confocal images of axons stained with anti‐acetylated α‐tubulin. (A, B) Larvae at SL 5–6 were fixed and stained in situ with the heart partially dissected. (C, D) Juvenile hearts at SL 10 demonstrated partial atrial and limited ventricular innervation in nrg1nc26/nc26 hearts. (E, F) Maximum intensity, z‐project of confocal images of dorsal surface of ventricle with atrium removed at SL10 with magnified view of representative innervated regions. (G, H) Quantification of ventricle surface innervation using methodology illustrated in (G) as the quotient of the total length of axons and ventricle surface. (H) Innervation quantified in N > 3 hearts at SL 10 ± 1, SL 15 ± 1 and SL 17.5 ± 1. Abbreviations a = atrium, v = ventricle, ba = bulbous arteriosus. Scale bars are 100 μm. Student's t‐test mutant compared to wild‐type. Error bars are S.E.M. *P = 0.01–0.05. Blue arrows point to axons.
Figure Data
Acknowledgments
This image is the copyrighted work of the attributed author or publisher, and
ZFIN has permission only to display this image to its users.
Additional permissions should be obtained from the applicable author or publisher of the image.
Full text @ J. Cell. Mol. Med.