
Fig. 4
- ID
- ZDB-IMAGE-180613-8
- Publication
- Lopez-Baez et al., 2018 - Wilms Tumor 1b defines a wound-specific sheath cell subpopulation associated with notochord repair.
- All Figures
- Figures for Lopez-Baez et al., 2018
|
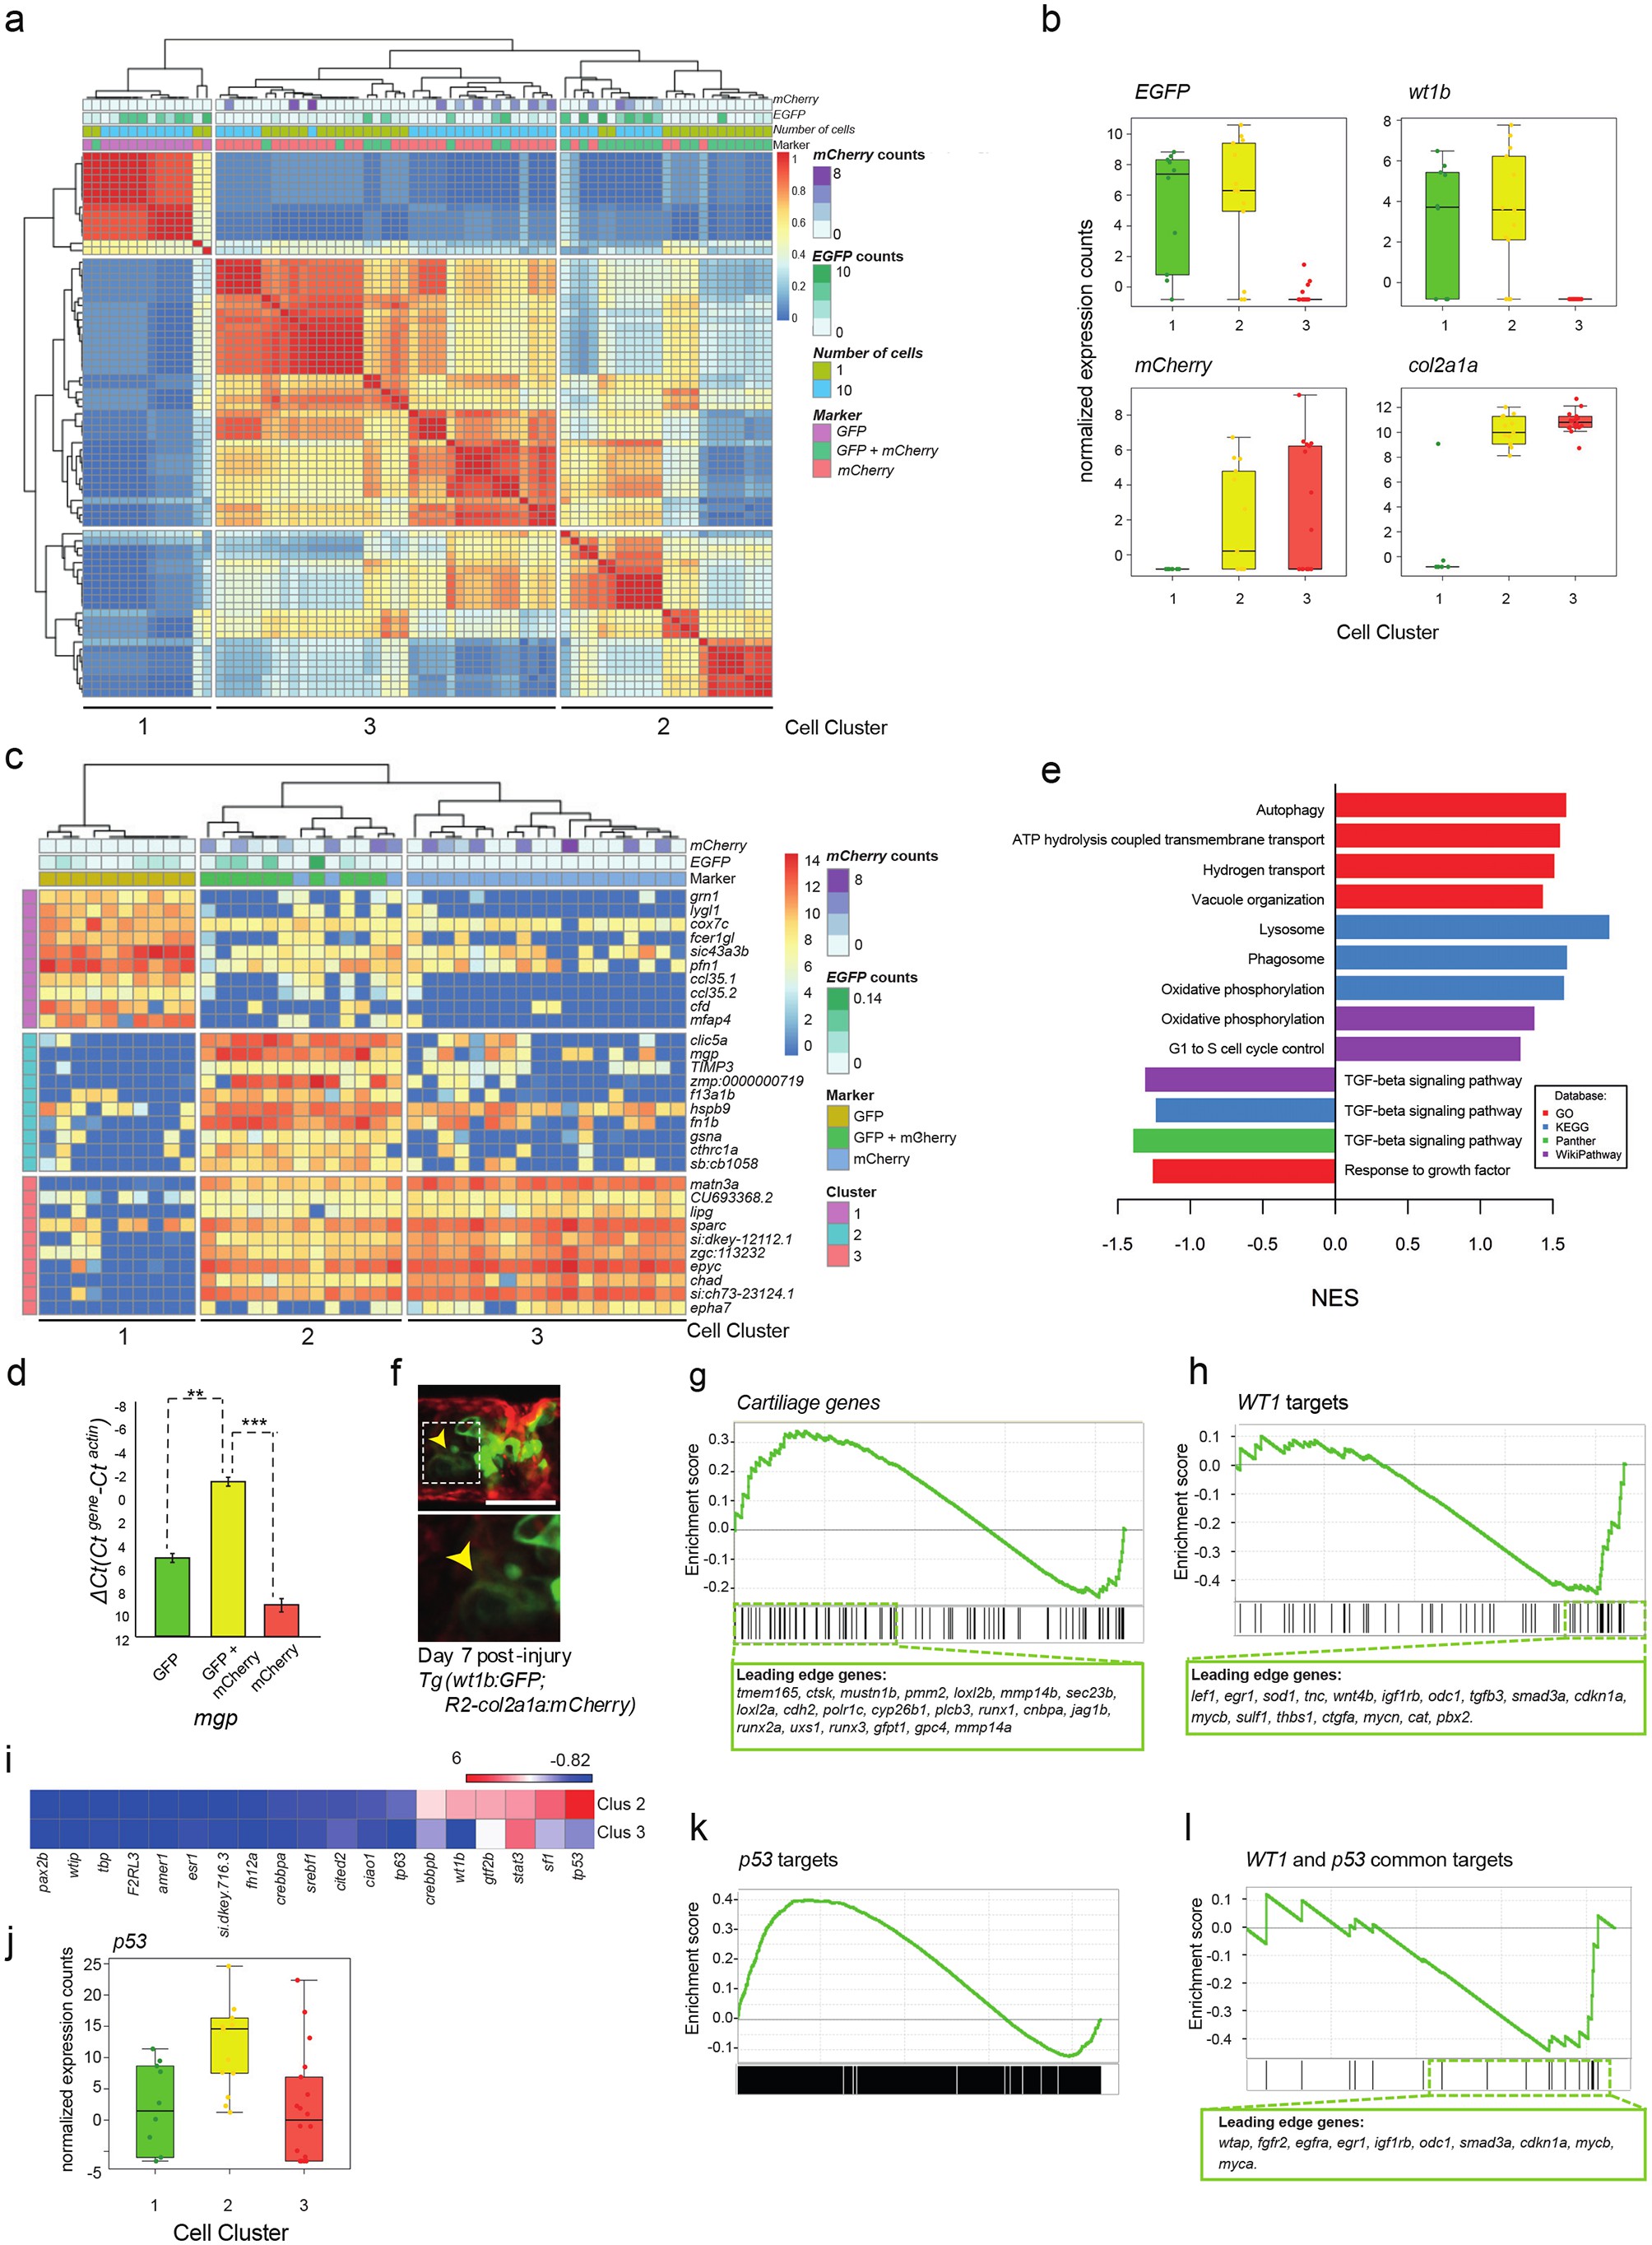
Fig. 4
Single-cell and 10 cell sequencing of wt1b-shealth cell populations.
(a) Single-cell and 10 cell SC3 unbiased clustering analysis reveals three distinct cell populations marked by GFP (cluster 1), mCherry (cluster 3), or GFP and mCherry (cluster 2). (b) GFP, mCherry, wt1b and col2a1a expression in 10 cell clusters. (c) Top 10 differential gene expression marker genes for 10 cell clusters. (d) Expression of mgp in different cell populations of injured zebrafish notochords. RNA was isolated from FACS sorted GFP, RFP and GFP/RFP expressing cells of the notochord of Tg(wt1b:gfp; R2-cola2a1a:mCherry) embryos, and gene expression was determined by qPCR. The y-axis indicates the difference between the cycle threshold (Ct) value of the gene of interest and the Ct value of beta-actin in injured and uninjured notochord. The y-axis is inverted for ease of interpretation. p-values are determined by paired t-test. Bars represent standard deviation. mgp: **p=0.035. Experimental replicates = 2. See Source Data file (Figure 4—source data 1). (e) Bar chart depicting functional analysis of differentially expressed genes between 10 cell SC3 cluster 2 and cluster three against five databases. Normalised enrichment score (NES, x-axis) calculated using online functional enrichment tool WebGestalt resource. Coloured bars match specific databases. (f) Images of the wound site seven days post injury in Tg(wt1b:gfp;col2a1a:mCherry); nacre-/- embryos. Arrows indicate vacuole-like structures. n = 7; experimental replicates: 1. Scale bar: 50 μm. (g) Gene set enrichment analysis (GSEA) of cartilage genes in wt1-expressing sheath cell (cluster 2) 10 cell group clusters (21 out of 82 genes were positively enriched; NES = 0.90). (h) GSEA of WT1 gene targets in wt1b-expressing sheath cell (cluster 2) 10 cell group clusters (19 out of 56 target genes were negatively enriched; NES = −1.44). (i) Heatmap of expression of WT1-interacting partners in 10 cell cluster 2 and cluster 3. (j) p53 RNA expression in 10 cell clusters. (k) GSEA of p53 targets genes in wt1b-expressing sheath cell (cluster 2) 10 cell group clusters (358 out of 1442 genes were positively enriched; NES = 1.17). (l) GSEA of common p53 and WT1 gene targets in wt1b-expressing sheath cell (cluster 2) 10 cell group clusters (10 out of 19 genes were negatively enriched, NES = −1.11).