
|
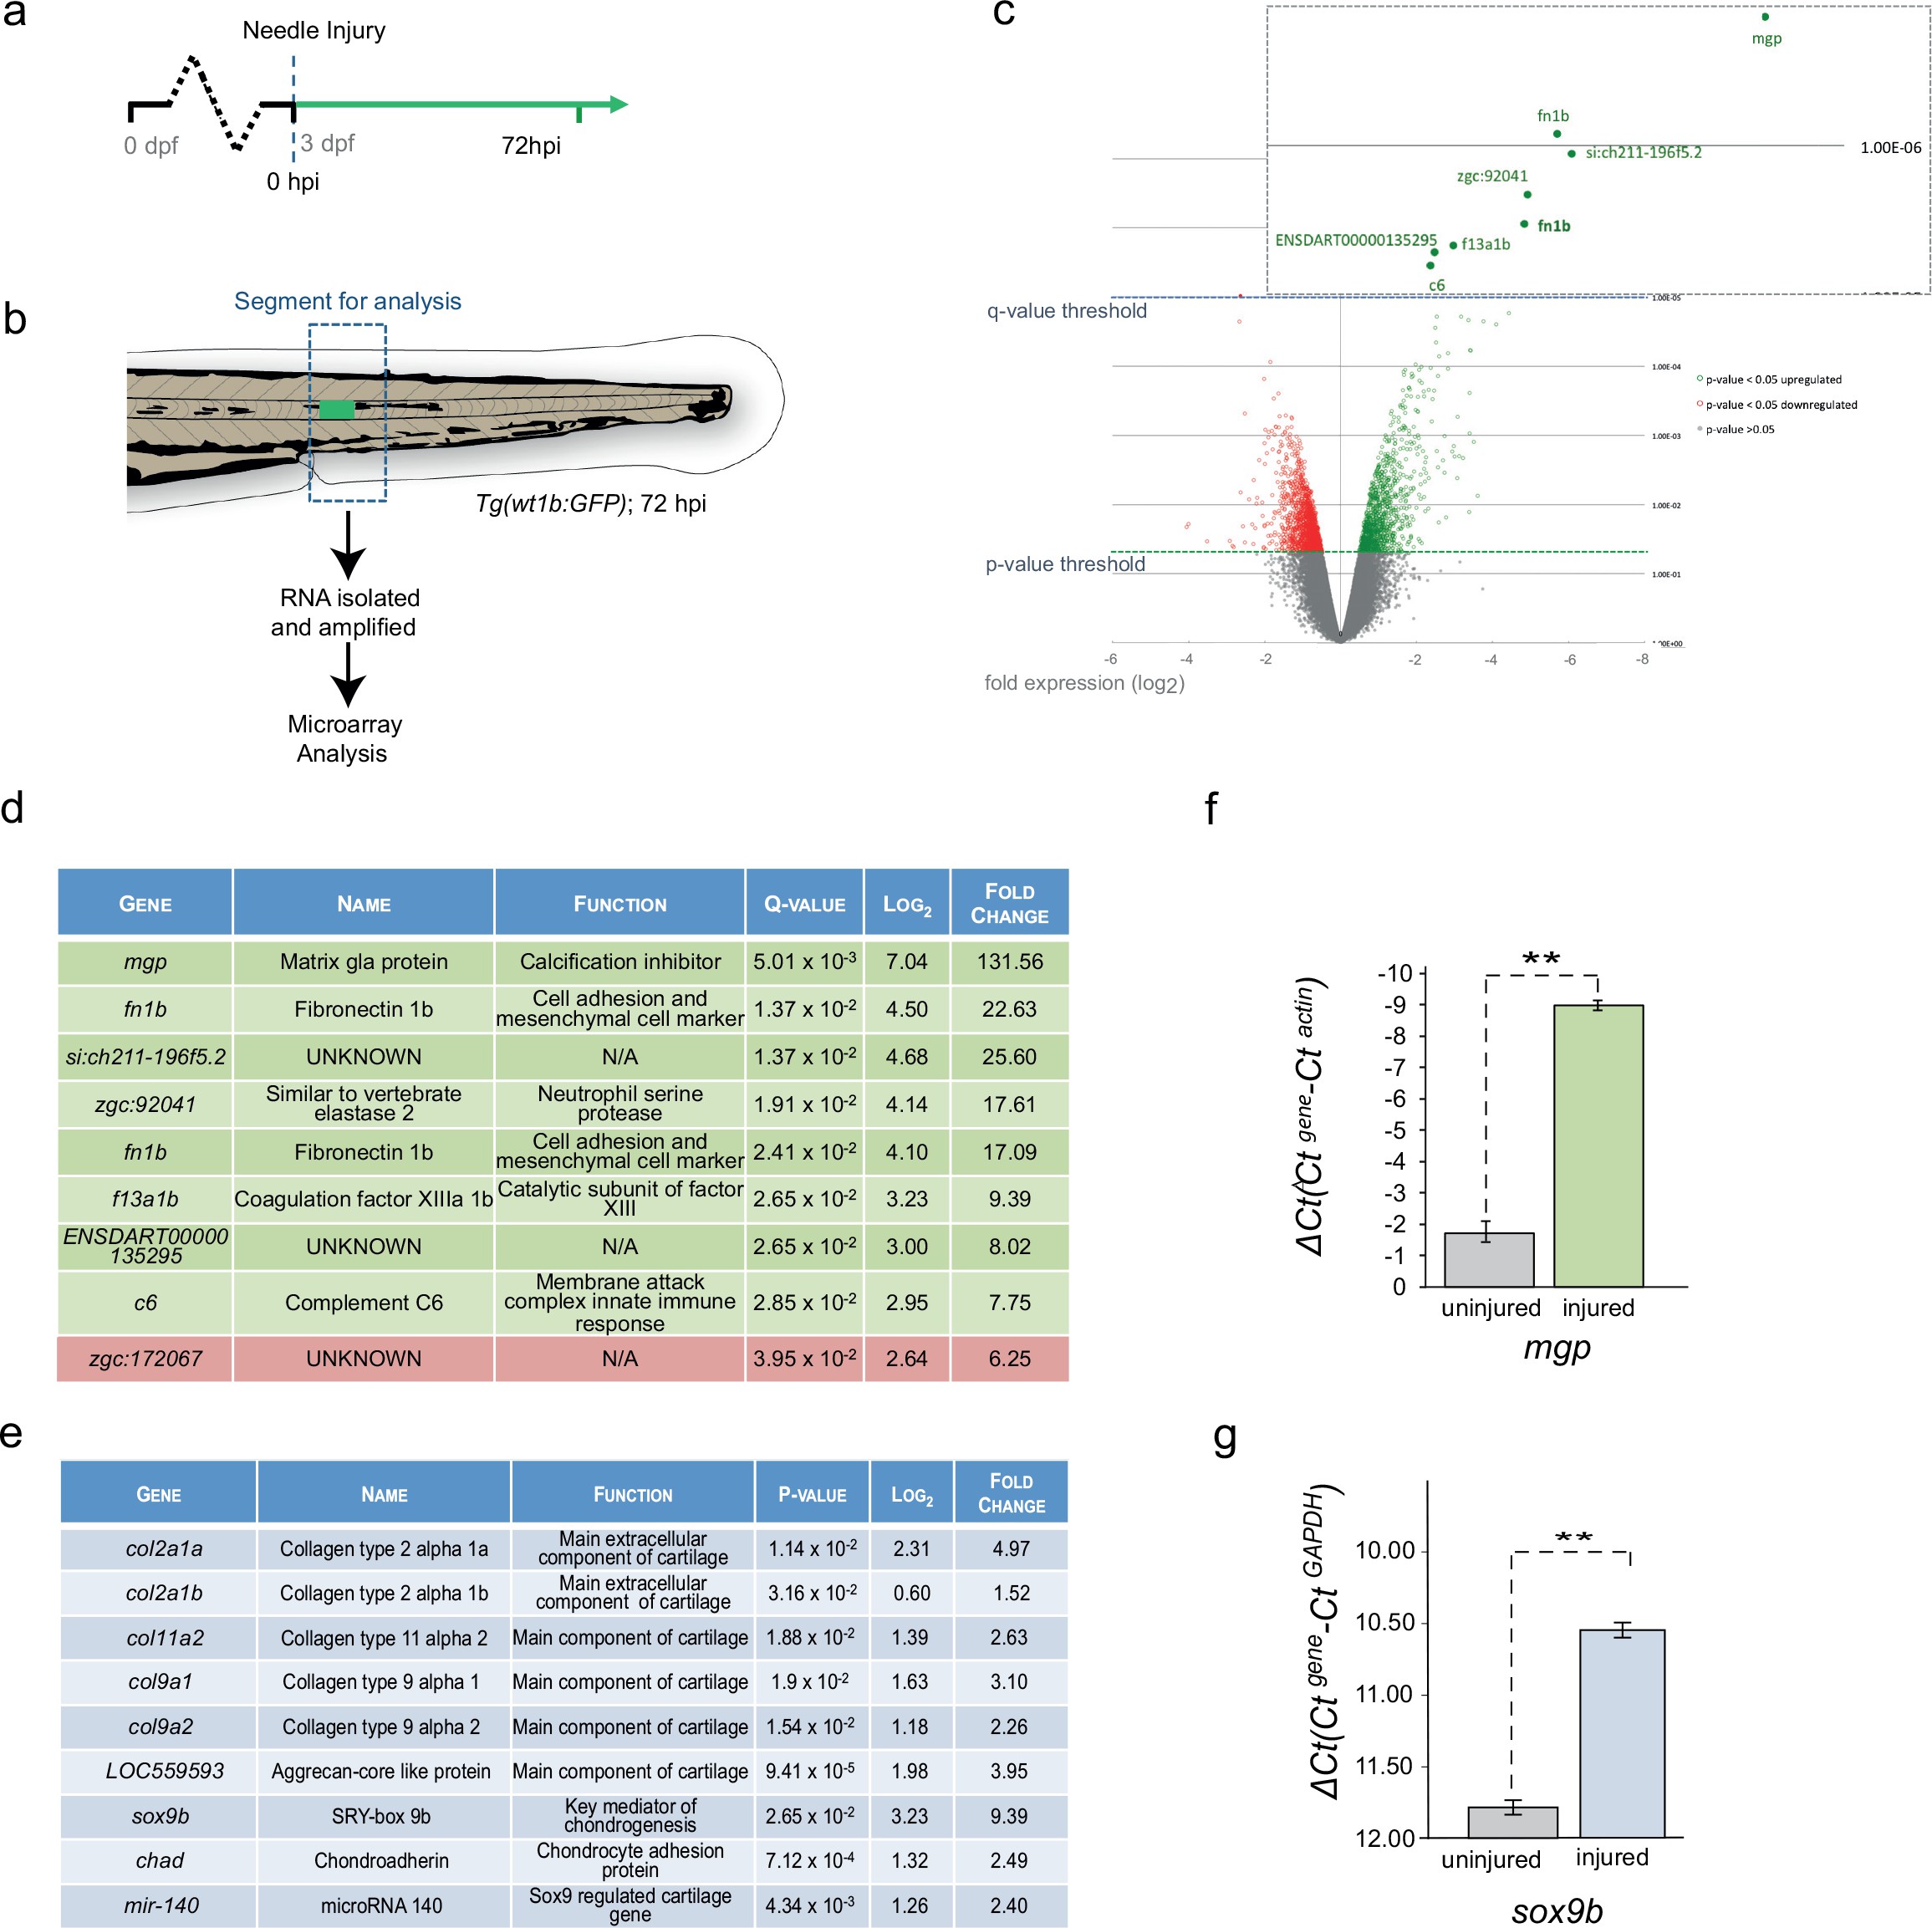
Fig. 3
Cartilage genes are expressed in the notochord-injured zebrafish.
(a) Experimental plan: 3 dpf Tg(wt1b:gfp) larvae were needle injured and grown for 72 hr with uninjured age-matched controls (n = 50 larvae per group). (b) The area around the wt1b:gfp expression was excised at 72 hpi (dotted area) and RNA was extracted and amplified. A similar area was taken from age-matched uninjured controls. (c) Volcano plot displaying the differentially expressed genes between injured and non-injured larvae. The y-axis measures the mean expression value of log 10 (p-value) and separates upregulated from downregulated genes. The x-axis represents the log2 fold change of expression. Significantly upregulated genes are shown as green circles or dots and downregulated genes are shown as red circles or dots. Green dotted line represents the p-value threshold (p<0.05) and blue dotted line represents the false discovery rate (FDR) or q-value threshold (q < 0.05). Genes with highest expression change are shown in magnified view. (d) Table showing the most significantly differentially expressed genes in injured larvae (q < 0.05). Upregulated genes are shown in green and downregulated genes are shown in red. (e) Table showing cartilage-associated genes that were significantly upregulated in the injured larvae (p<0.05). (f, g) Results of quantitative real-time PCR (qRT-PCR) of mgp and sox9b. The y-axis indicates the difference between the cycle threshold (Ct) value of the gene of interest and the Ct value of β-actin for mgp and gapdh for sox9b. Note that the y-axis is inverted to ease interpretation. Bars represent standard deviation from the mean. mgp **p=0.025; sox9b ***p=0.007; paired t-test; Experimental replicates: mgp = 2; sox9b = 1 at 48 hpi, and 1 at 72 hpi (40 embryos pooled per replicate). See Source Data files (Figure 3—source data 1; Figure 3—source data 2).