
|
Fig. 2-S1
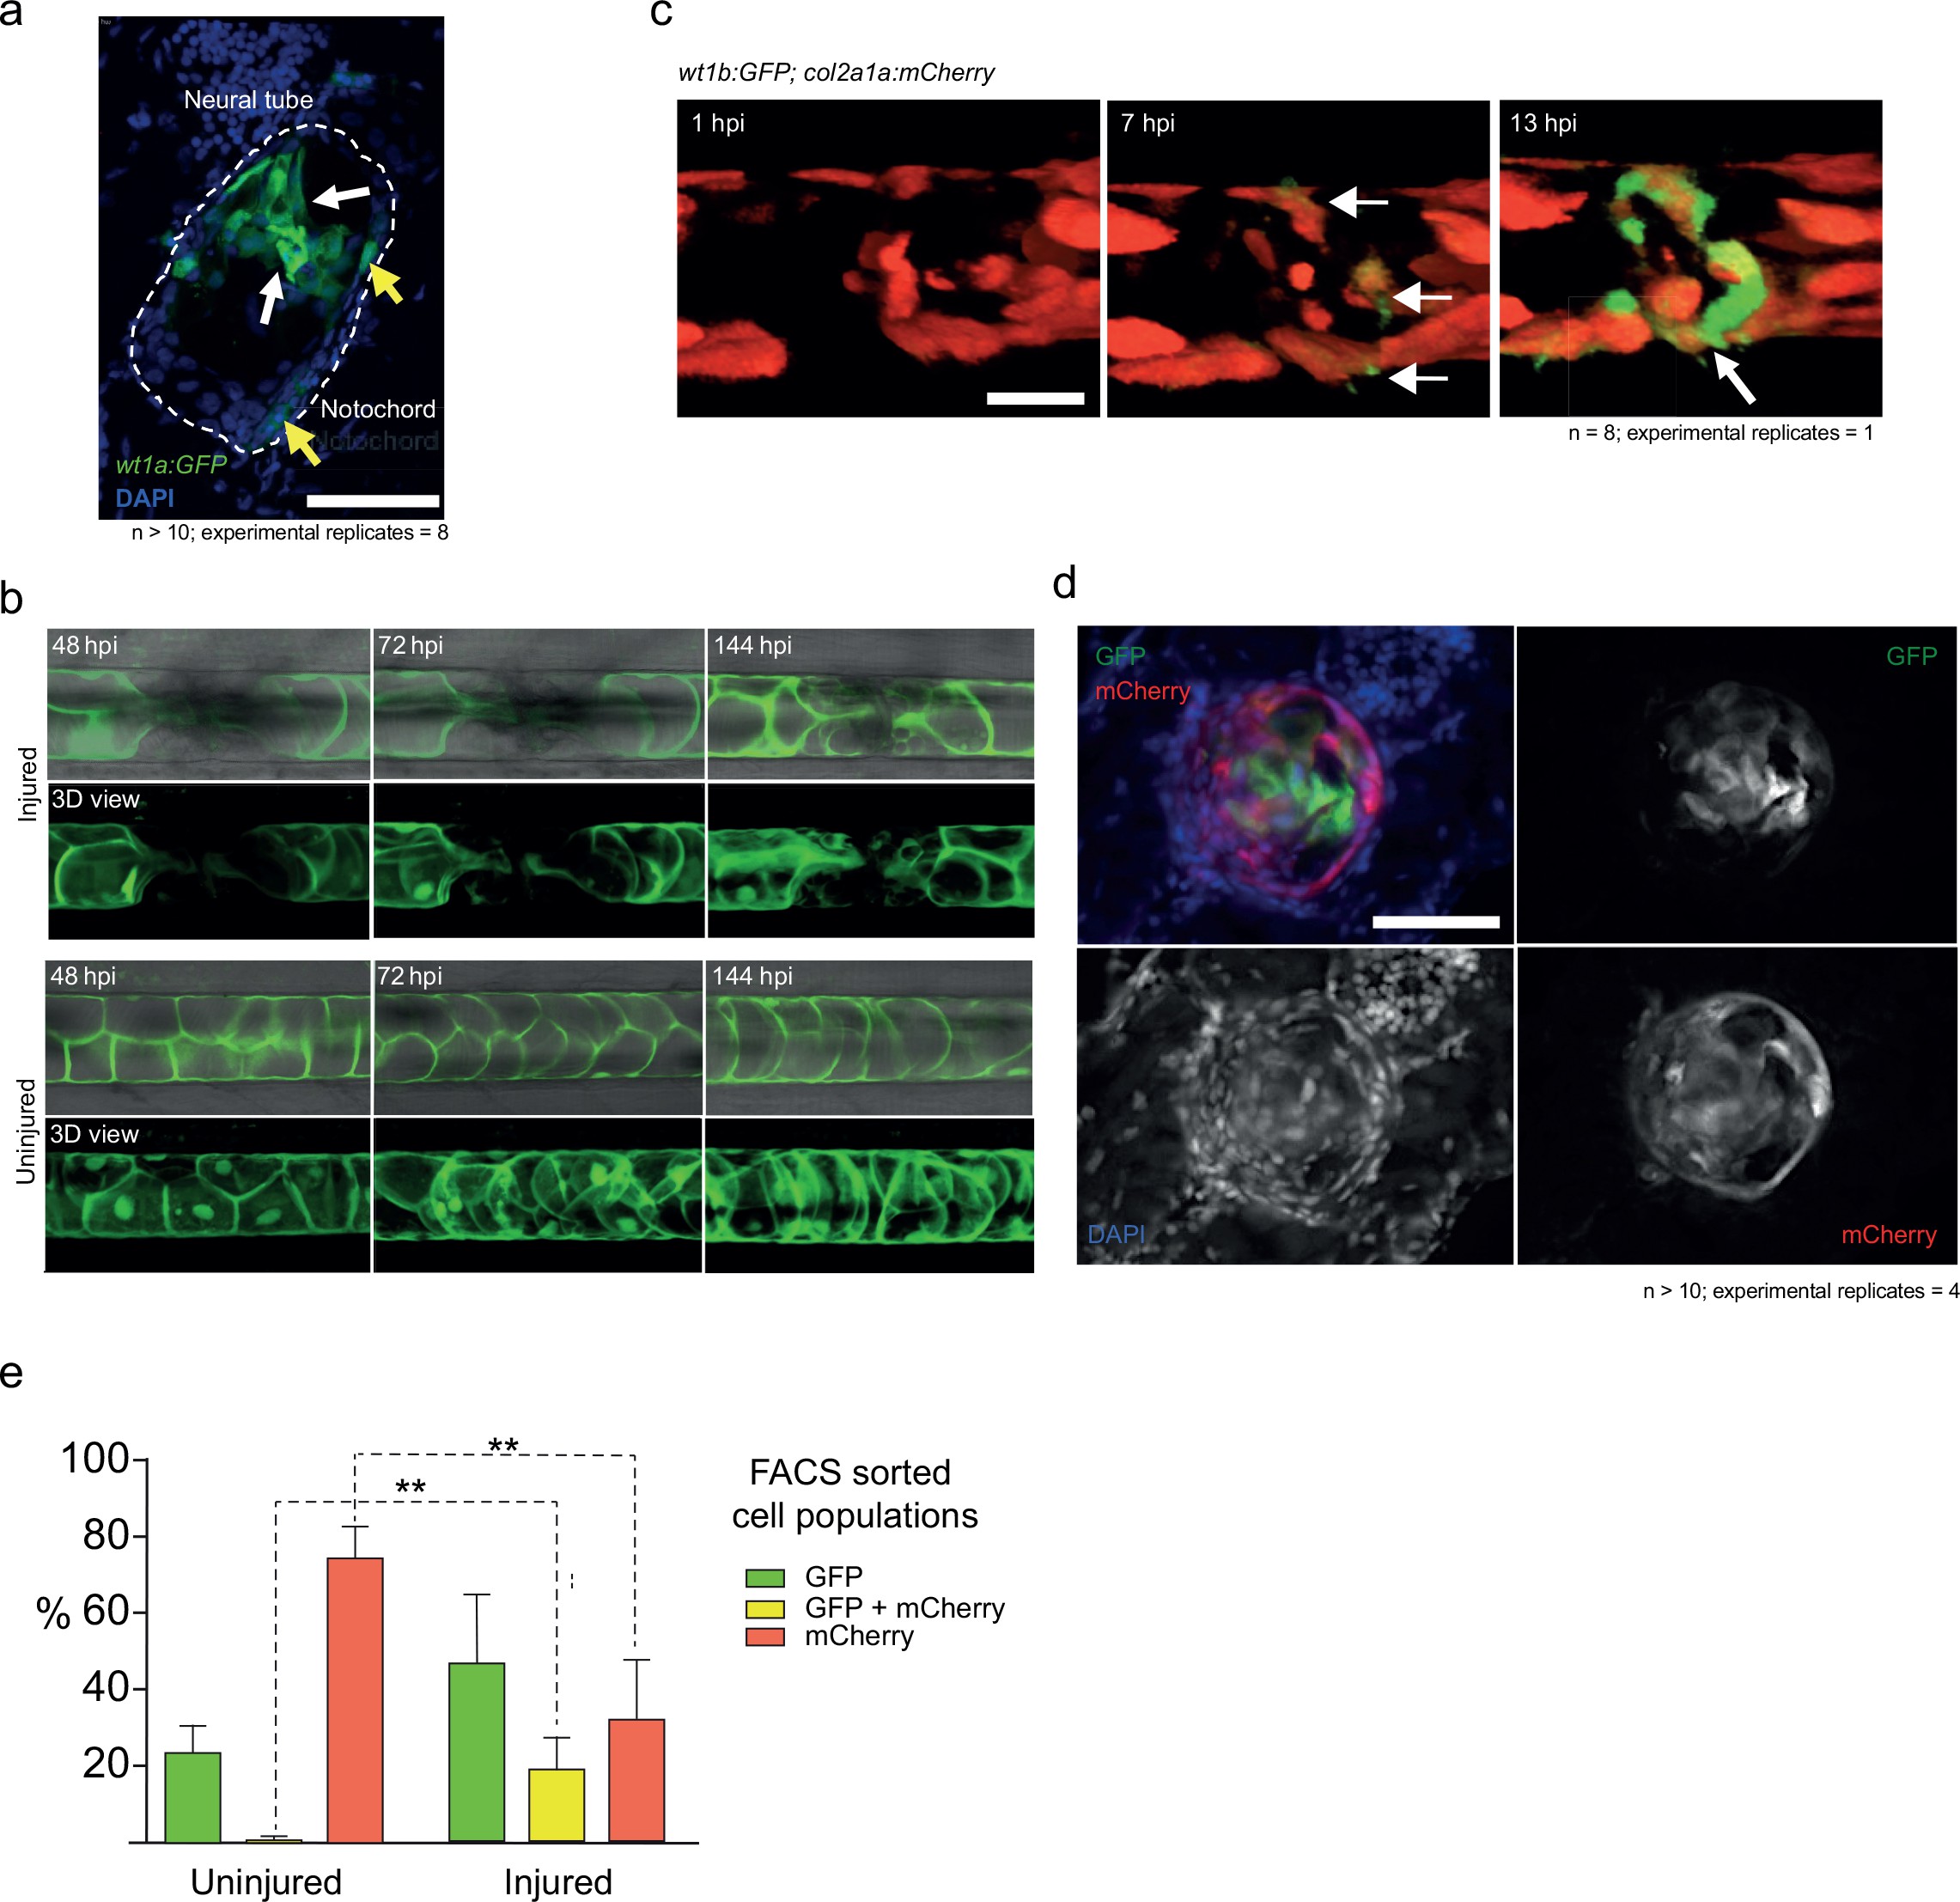
Imaging cell populations at the wound.
(a) Cross-sections of the injured notochord shows two populations of wt1b:gfp-positive cells. Epithelial-like cells at the edge of the notochord (yellow arrows) and mesenchymal-like cells invading the central aspects of the notochord (white arrows). n > 10; experimental replicates = 4. Scale bar: 50 µm. (b) 3 dpf Tg(SAGFF214A:GFP) larvae were imaged at 48, 72 and 144 hpi. The needle injury created a cell-free gap in the row of vacuolated cells, which appeared to be populated over time with new SAGFF214A:GFP expressing cells. n = 8; experimental replicates = 1. Scale bar: 50 µm. (c) Confocal imaging of mosaic Tg(wt1b:gfp; R2-col2a1a:mCherry) larvae showed that mCherry+ sheath cells began to express GFP upon needle injury, forming a ring around the damaged area (arrows). Scale bar: 100 µm. (d) Cross-sectional cryo-sections of the injured notochord of 72 hpi Tg(wt1b:gfp; R2-col2a1a:mCherry) larvae highlight the presence of a mixed population of GFP and mCherry cells inside the notochord. n > 10; experimental replicates = 4. Scale bar: 20 µm. hpi = hours post injury. (e) Bar graph of FACS sorted cell populations from uninjured or injured Tg(wt1b:gfp; R2-col2a1a:mCherry) larvae. N = 4 experimental replicates. Multiple t-tests. ** p-value=0.005, ** p-value=0.002. See Source Data file (Figure 2—figure supplement 1—source data 1).