
|
Fig. 1-S1
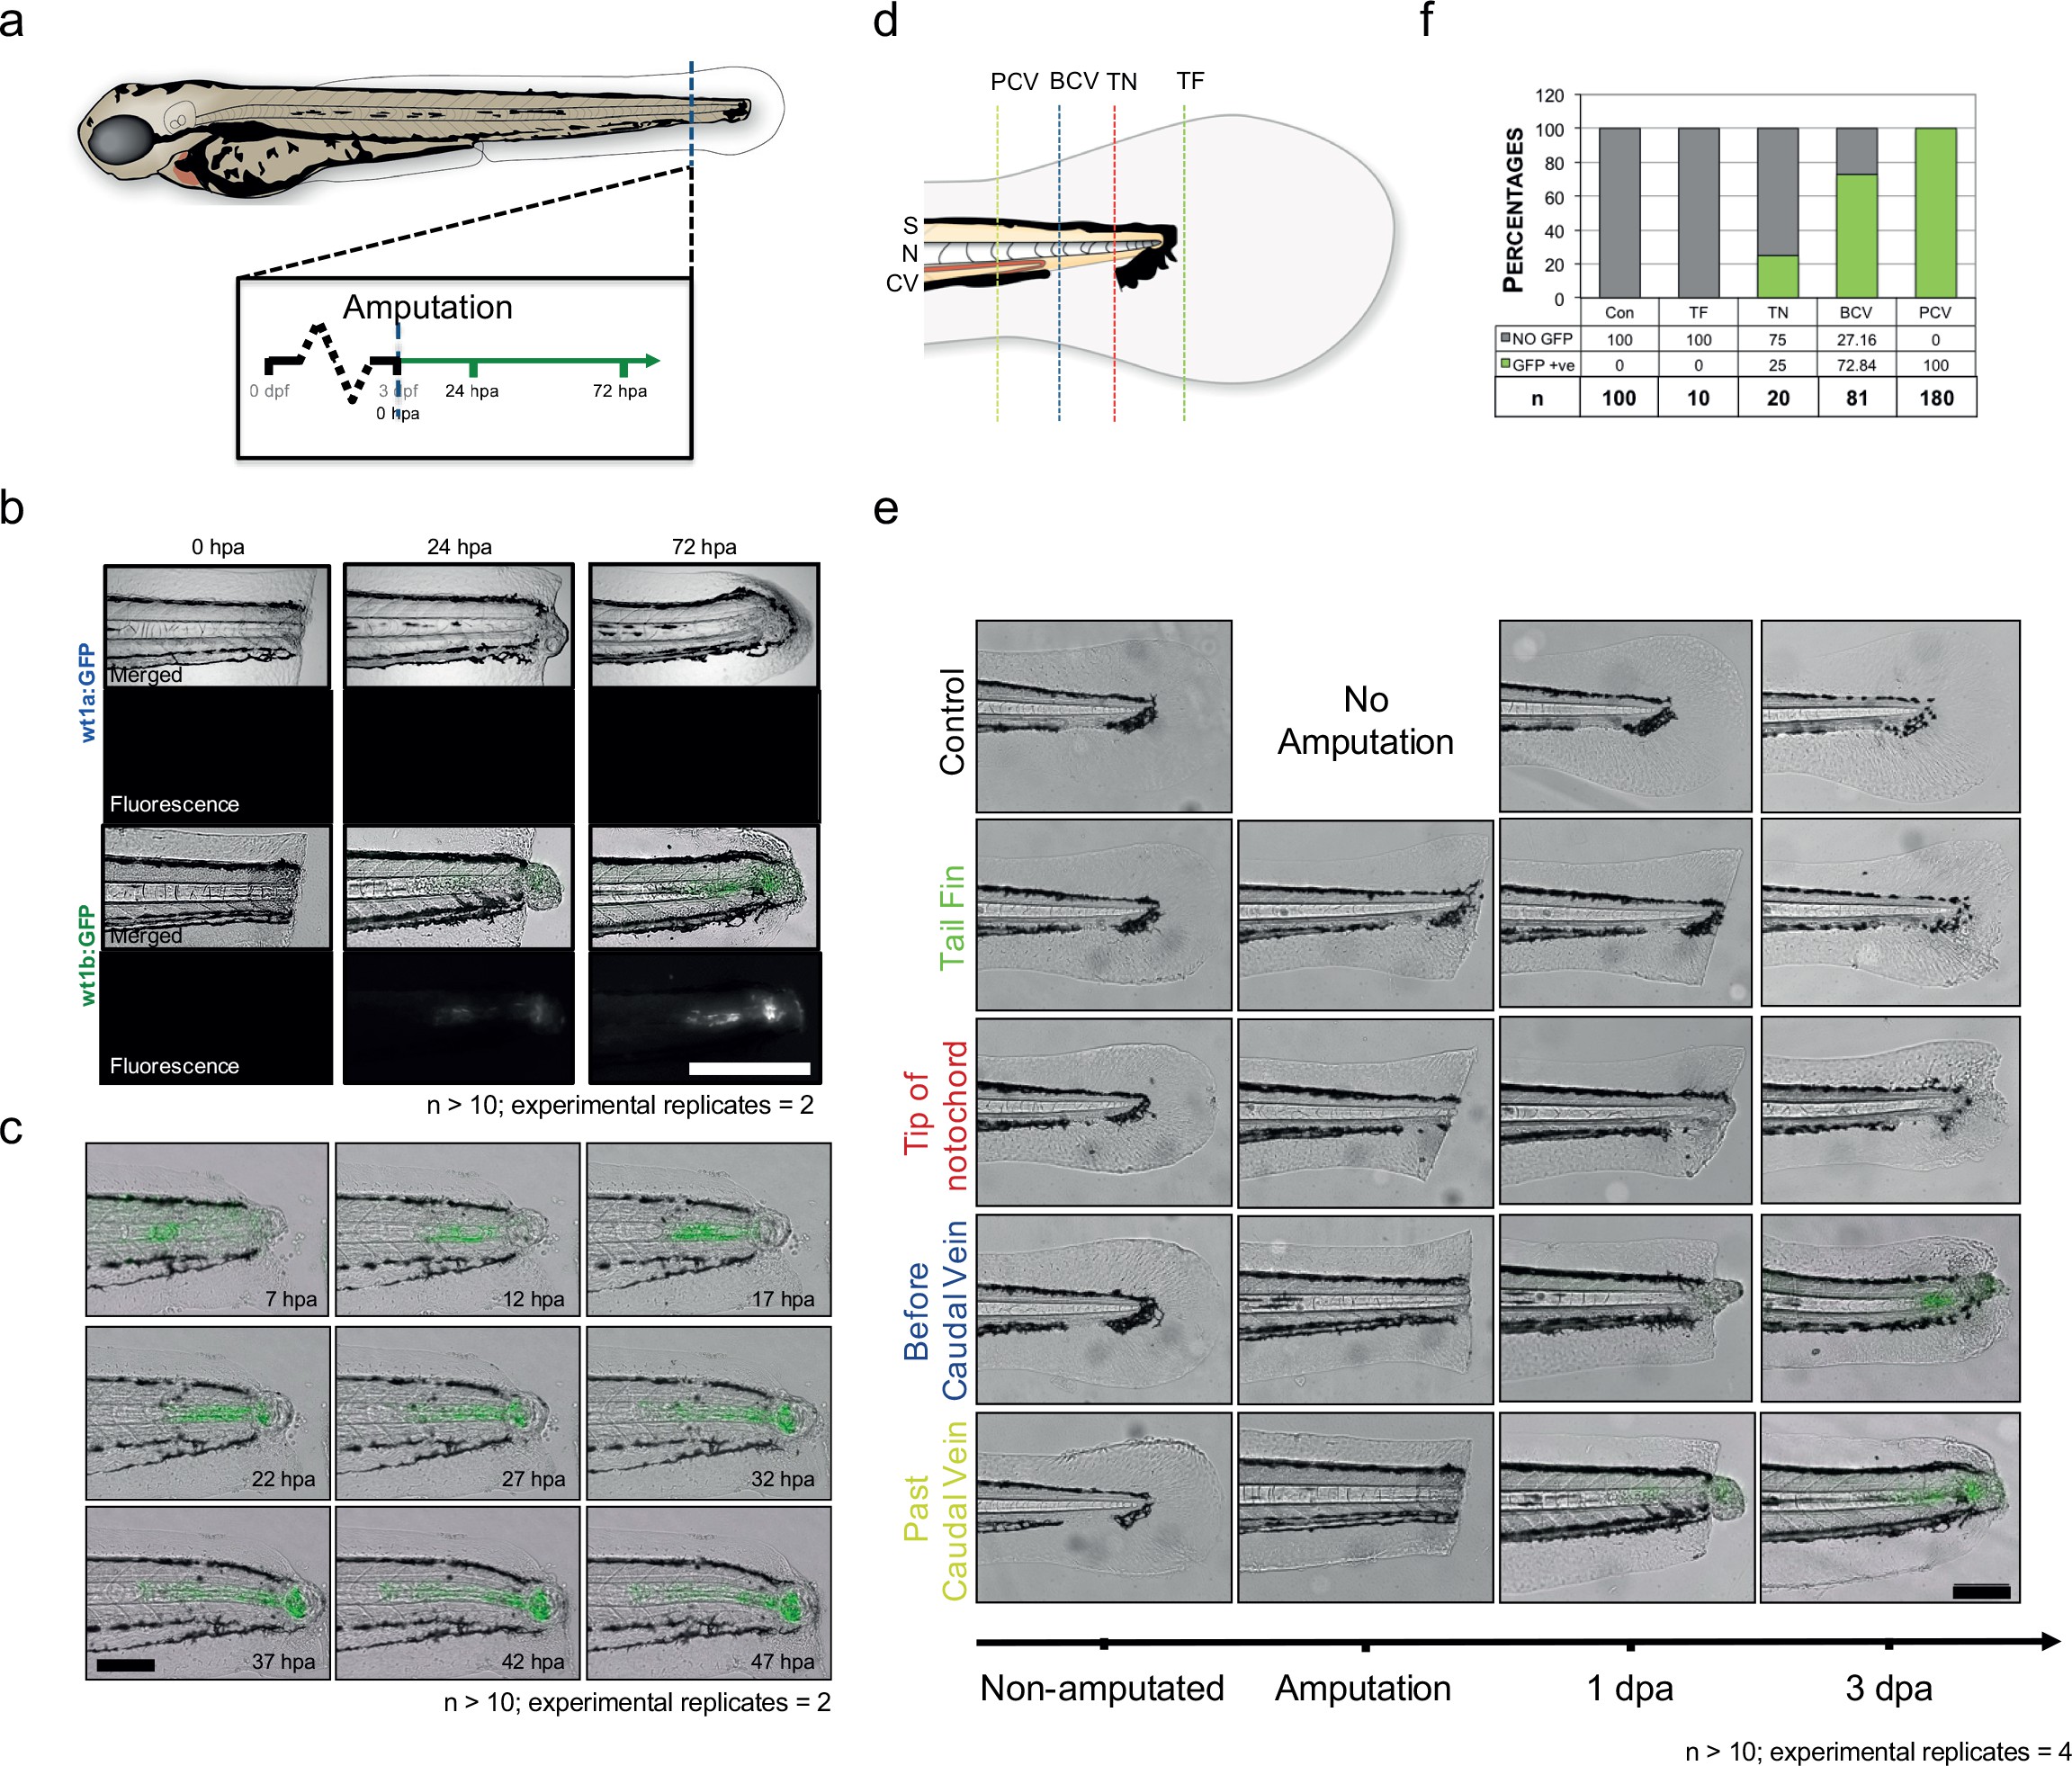
wt1b expression in tail amputated larvae.
(a) 3 dpf Tg(wt1a:gfp) and Tg(wt1b:gfp) larvae were tail amputated and imaged at 0, 24 and 72 hpa. (b) Brightfield and fluorescence imaging were performed at the designated time-points. A distinctive change of cellularity occurred in the notochords of amputated larvae, leading to the upregulation of GFP in the notochord of Tg(wt1b:gfp) but not Tg(wt1a:gfp) injured larvae. n > 10; experimental replicates = 2. Scale bar: 100 µm. (c) Time-lapse analysis of amputated 3 dpf Tg(wt1b:gfp) showed that the GFP response starts at 7 hpa and develops over time, arising at a site distant to the cut but then moving towards the amputated area. n > 10; experimental replicates = 4. Scale bar: 100 µm. (d) Selected tail amputations were performed on 3 dpf Tg(wt1b:gfp) larvae: tail fin only (TF), tip of notochord (TN), before caudal vein (BCV) and post caudal vein (PCV). (e) Tail amputations triggered a GFP response in TN, BCV and PCV amputated Tg(wt1b:gfp) larvae, with PCV amputated larvae expressing wt1b:gfp at earlier stages. TF amputation did not trigger a GFP response. n > 10; experimental replicates = 2. Scale bar: 100 µm. (f) Deeper tail amputation led to a higher percentage of GFP responses. The y-axis represents the percentage of GFP positive responses and the ‘GFP +ve’ and ‘NO GFP’ numbers are given as percentages of the number of larvae used per amputation experiment. dpf = days post fertilization; hpa = hours post fertilization; S = somite; N = notochord; CV = caudal vein; n = number of larvae.