
|
Fig. S2
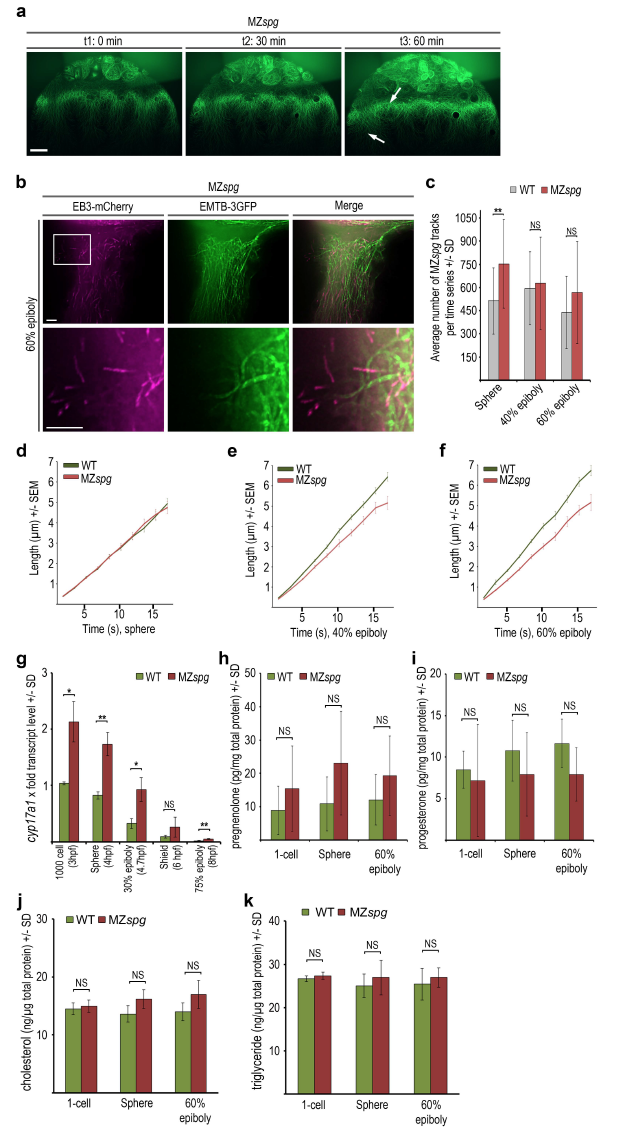
Analysis of YCL microtubule dynamic behavior and steroidogenic pathways in MZspg mutant embryos
(a) Live images of a mutant MZspg embryo during epiboly progression. Embryo injected with EMTB- 3GFP mRNA at 1-cell stage. Selected images of a time series, timepoints t1-t3 correspond to: t1 30% epiboly (0 min), t2 50% epiboly (30 min), t3 shield (60 min). Arrows mark developing alterations of abnormal microtubule arrays in between regions with wild-type like appearance. Confocal zprojection, lateral view, animal to the top, scale bar 50 μm.
(b) TIRF time series projection (5 frames, 8.5 s in total) of MZspg mutant embryo YCL region labeled with EMTB-3GFP (green) and EB3-mCherry (magenta) revealing defects in microtubule assembly at border between thickened microtubule bundles and microtubule devoid zone (upper row). Lower row shows magnification of the region marked by the square. Lateral view, animal to the top, scale bar 5 μm.
(c) Quantification of the average number of EB3-mCherry tracks at indicated stages of wild-type and MZspg embryos. Error bars indicate SD. Number of EB3-mCherry comets in the mutant MZspg YCL with 753 (SD 287) at sphere, 628 (SD 300) at 40% epiboly, and 568 (SD 331) at 60% epiboly. Differences of track numbers between sphere, 40% and 60% epiboly in MZspg were not significant (Mann-Whitney test). Comparing MZspg and wild-type, differences were statistically significant only at sphere (p < 0.005; Mann-Whitney test).
(d-f) The speed of microtubule growth plotted as EB3-mCherry track length (μm) over track duration (s) at sphere (d), 40% epiboly (e), and 60% epiboly (f) for MZspg compared to wild-type embryos. Error bars indicate SEM. Same dataset analyzed as in Fig. 3c.
(g) Relative transcript levels of cyp17a1 determined by qRT-PCR for stages from 1000-cell to 75% epiboly for wild-type (grey bars) and MZspg (red bars) embryos. Expression levels normalized to wild-type 1000-cell stage. Error bars indicate SD (n = 3). Differences of expression levels between wild-type and MZspg were statistically analyzed (t-test): p < 0.005: sphere, 75% epiboly; p < 0.05: 1000-cell, 30% epiboly; NS: shield.
(h, i) Levels of pregnenolone (h) and progesterone (j) quantified by ELISA in wild-type and MZspg embryo lysates at indicated stages. Error bars indicate SD (n = 6). At 60% epiboly the calculated progesterone content per embryo was wild-type 1.2 pg (SD 0.71), MZspg 0.78 pg (SD 0.58) and the pregnenolone content wild-type 1.09 pg (SD 0.74), MZspg 2.49 pg (SD 1.85). Statistical test (Mann- Whitney test) did not reveal significant differences between wild-type and MZspg at each stage.
(j, k) Levels of cholesterol (j) and triglycerides (k) quantified by colorimetric enzyme assay of embryonic lysates at indicated stages. Error bars indicate SD (n = 3; exception: triglyceride for MZspg sphere n = 2). Differences in cholesterol and triglyceride levels between wild-type and MZspg embryos were statistically not significant (NS, Mann-Whitney test)
Reprinted from Developmental Biology, 434(2), Eckerle, S., Ringler, M., Lecaudey, V., Nitschke, R., Driever, W., Progesterone modulates microtubule dynamics and epiboly progression during zebrafish gastrulation, 249-266, Copyright (2017) with permission from Elsevier. Full text @ Dev. Biol.