
|
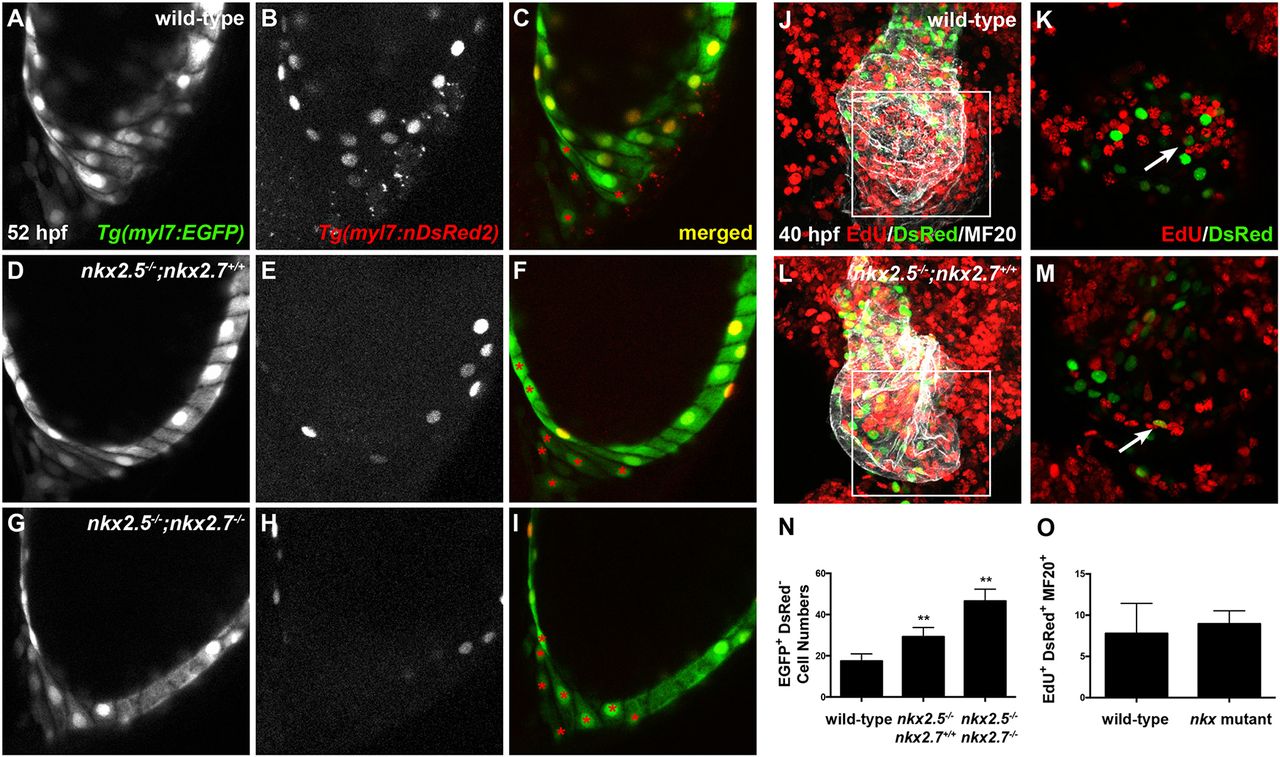
Fig. 6
Nkx genes regulate cardiomyocyte accretion to the atrium. (A-I) Lateral images, anterior towards the top, at 52 hpf. Representative reconstructions of 10 z-stacks from a developmental timing assay highlight the venous pole of wild-type (A-C), nkx2.5−/−;nkx2.7+/+ (D-F) and nkx2.5−/−;nkx2.7−/− (G-I) embryos carrying Tg(myl7:EGFP) (green) and Tg(-5.1myl7:nDsRed2) (red). Asterisks indicate EGFP+ DsRed− cells. (J-M) Ventral view, anterior towards the top, at 40 hpf of wild-type (J,K) and nkx2.5−/−;nkx2.7+/+ (L,M) embryos carrying Tg(-5.1myl7:nDsRed2). Confocal projections (J,L) of immunohistochemistry for EdU (red), DsRed (green) and MF20 (gray) following EdU incubation at 18 hpf and four z-stack reconstructions (K,M) were used to count EdU+ DsRed+ MF20+ CMs in the atrium. The boxed areas in J,L are shown at higher magnification in K,M, respectively. White arrows indicate EdU+ DsRed+ CMs. (N,O) Quantification of EGFP+ DsRed− cells at the venous pole for wild-type (n=12), nkx2.5−/−;nkx2.7+/+ (n=5) and nkx2.5−/−;nkx2.7−/− (n=4) embryos, and proliferation indices in wild-type (n=5) and nkx mutant (n=3) embryos. Student's t-test was used to determine statistical significance. Mean and s.e.m. of each data set are shown (**P<0.0001). There is no statistically significant difference between proliferation indices in the DsRed+ MF20+ populations of wild-type and nkx mutant embryos.