
|
Fig. 7
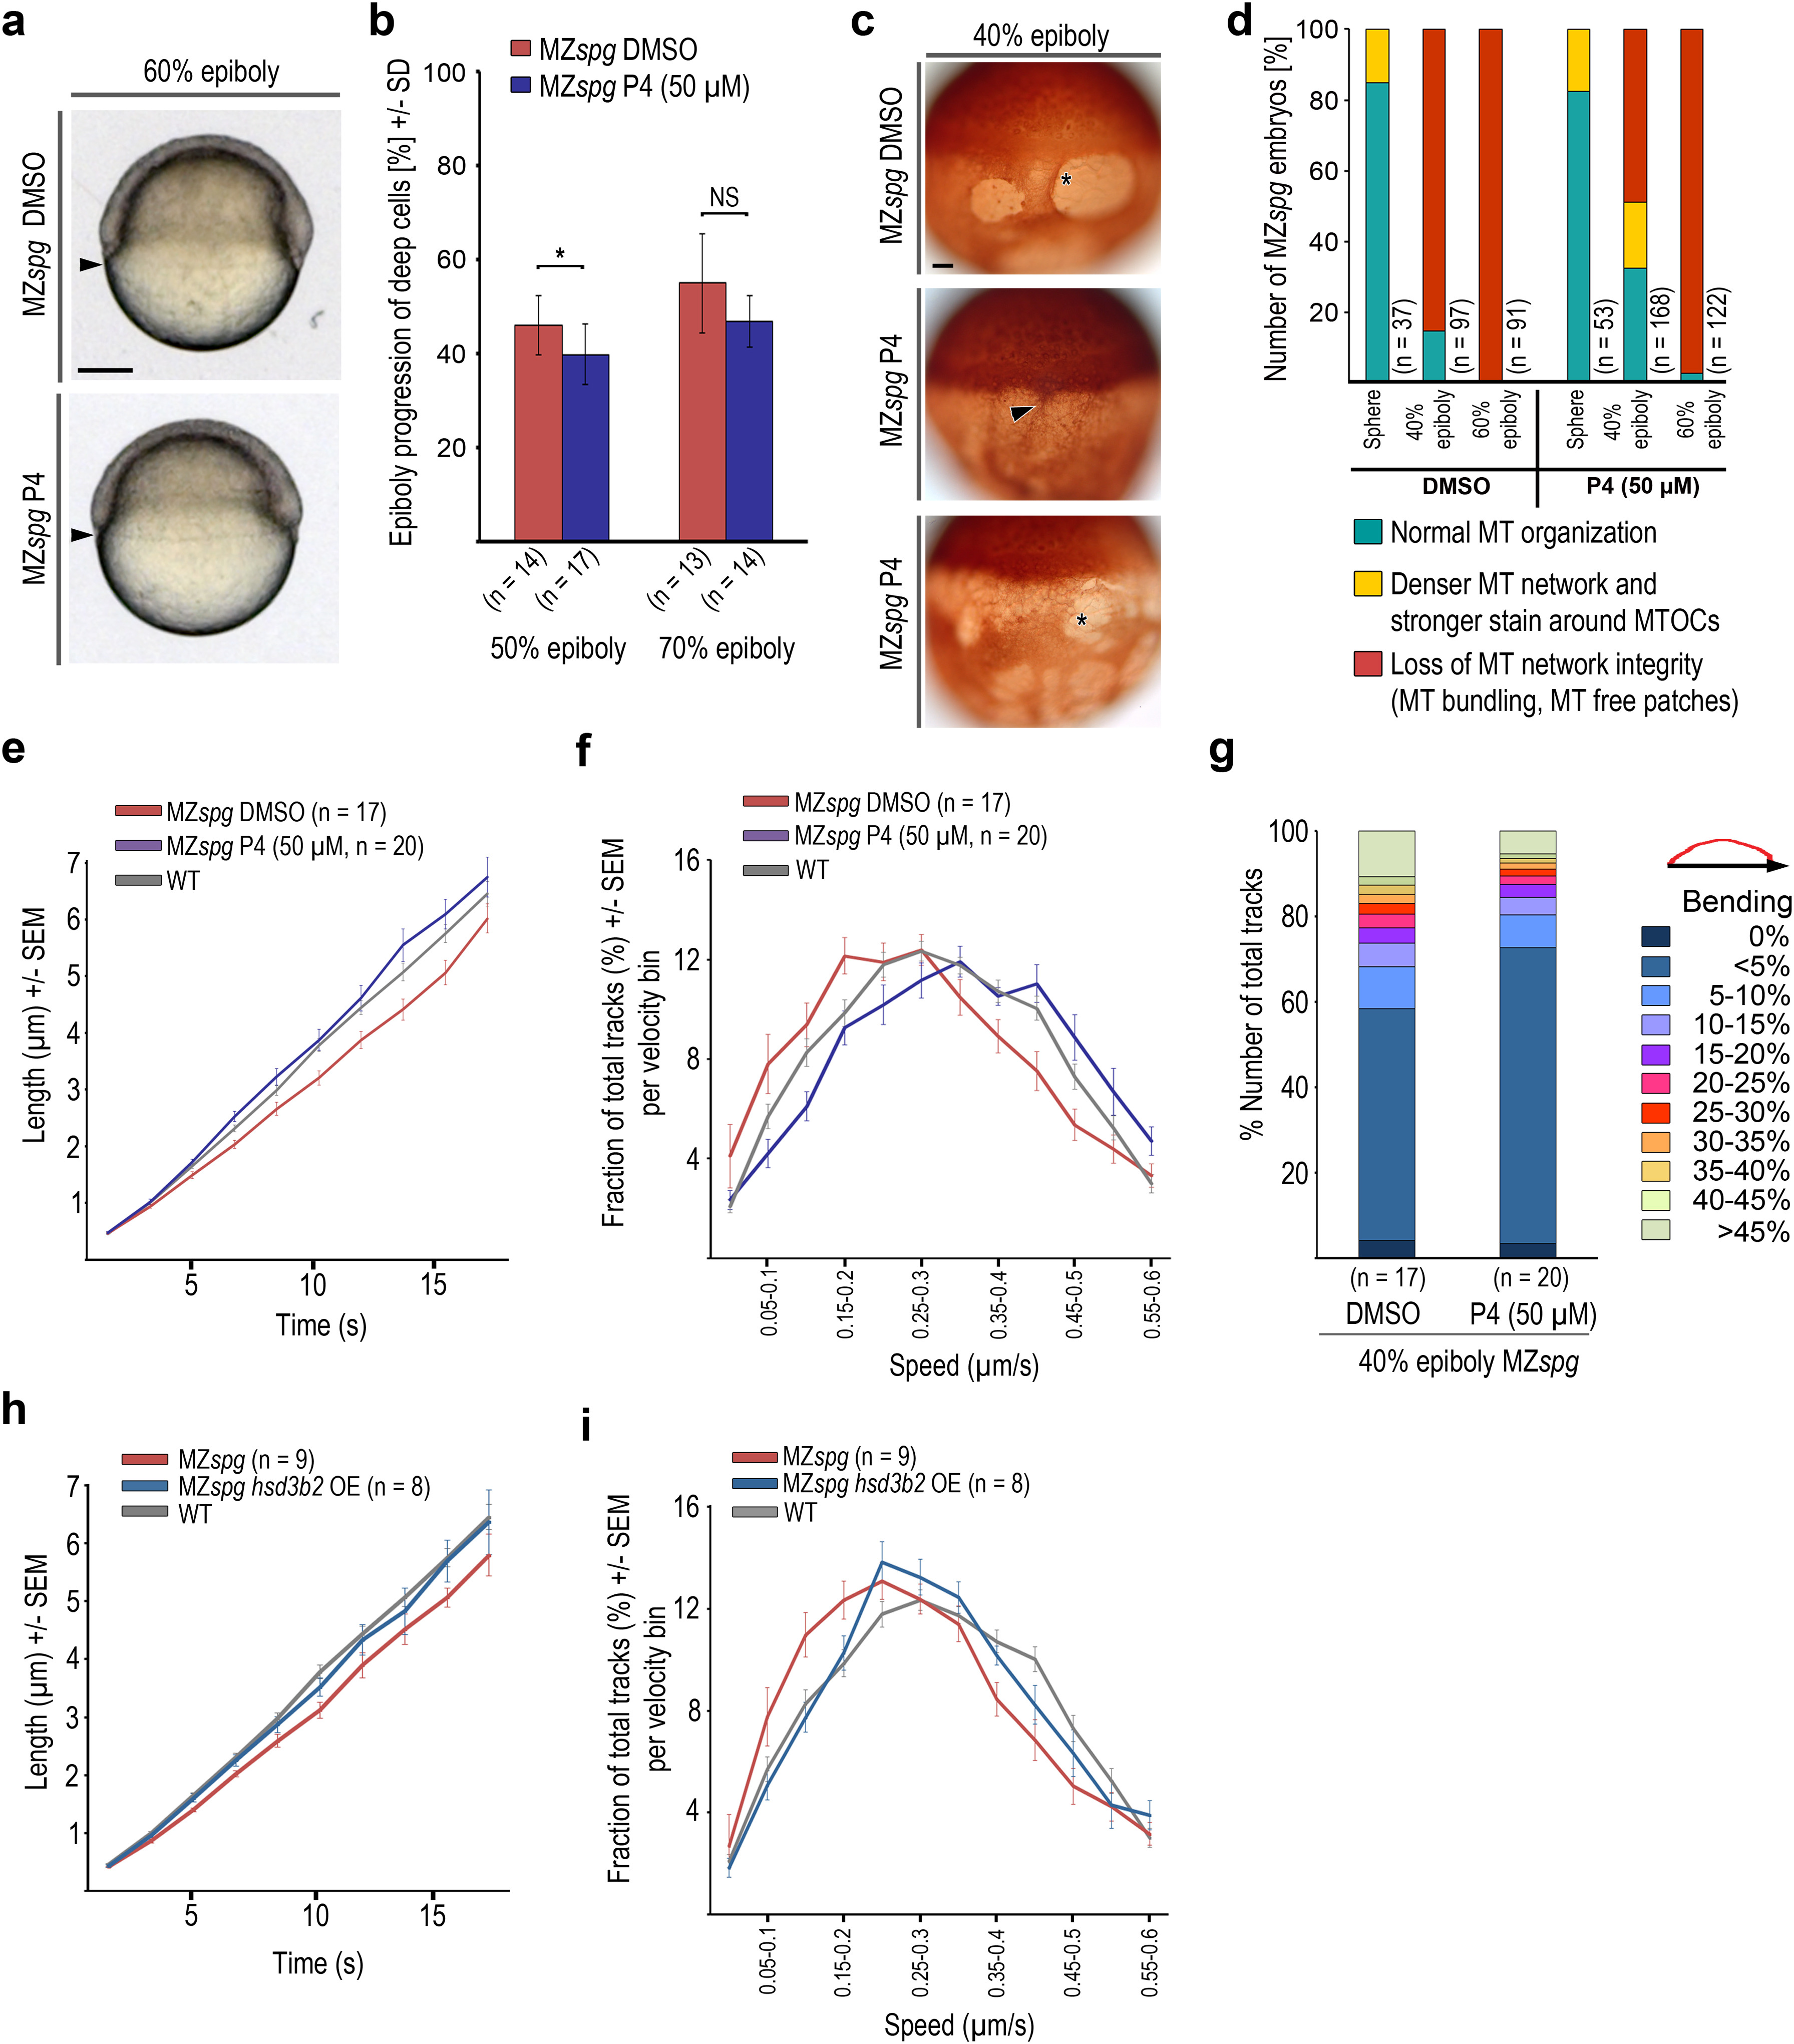
Progesterone treatment partially rescues microtubule growth dynamics in MZspg. (a) Live DMSO or progesterone (P4, 50 µM) treated MZspg embryos at 60% epiboly. Scale bar 100 µm. (b) Epiboly progression of DMSO or progesterone (P4, 50 µM) treated MZspg embryos at indicated stages. Error bars - SD. (* p<0.05 Mann-Whitney test). (c) Anti-β-tubulin immunostained DMSO or progesterone (P4, 50 µM) treated MZspg embryos at 40% epiboly. Arrowhead marks microtubule accumulation around the MTOCs and denser appearance of microtubule arrays, asterisks mark loss of microtubule network integrity with microtubule free patches. Scale bar 50 µm. (d) Quantification of microtubule phenotypes observed in experiment shown in panel (c). Classification of phenotypes as in Fig. 6d. (e, f) Microtubule growth rates (e) and track velocity distribution (f) at 40% epiboly stage for DMSO control and progesterone (50 µM) treated MZspg embryos. Wild-type data at 40% epiboly from Fig. 3c and d. Error bars - SEM. (g) Microtubule track bending in DMSO control and progesterone treated MZspg embryos at 40% epiboly. (h, i) Microtubule growth rates (h) and track velocity distribution (i) at 40% epiboly for MZspg control and hsd3b2 mRNA injected MZspg embryos. Wild-type data at 40% epiboly from Fig. 3c and d. Error bars - SEM.
Reprinted from Developmental Biology, 434(2), Eckerle, S., Ringler, M., Lecaudey, V., Nitschke, R., Driever, W., Progesterone modulates microtubule dynamics and epiboly progression during zebrafish gastrulation, 249-266, Copyright (2017) with permission from Elsevier. Full text @ Dev. Biol.