
|
Fig. S2
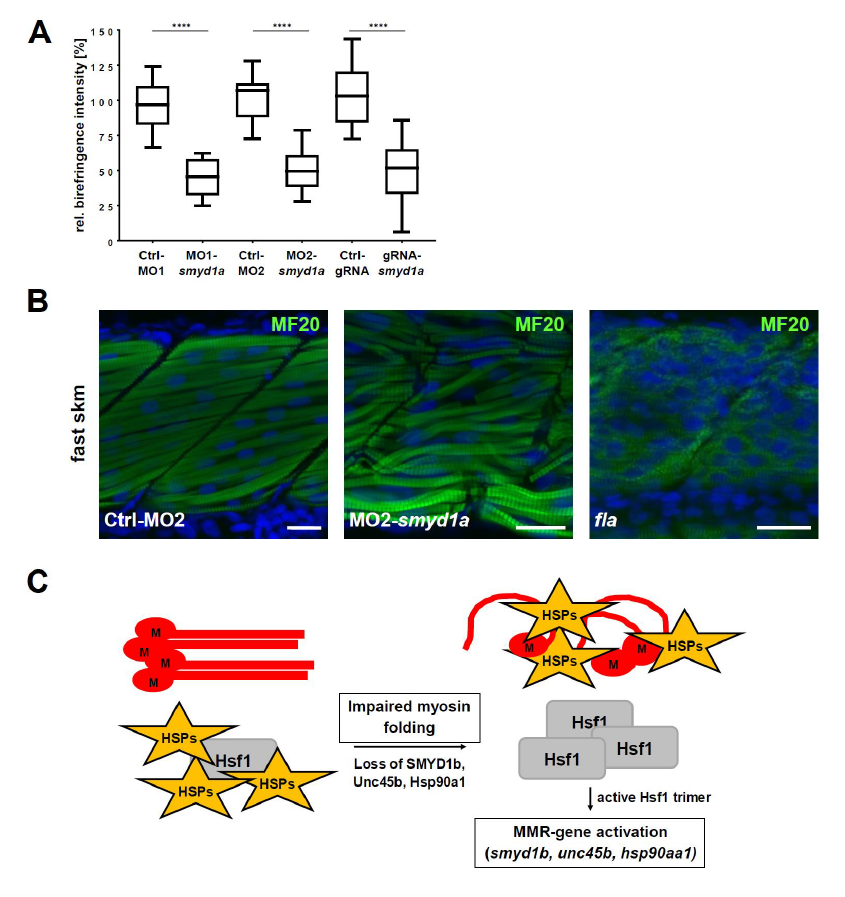
(A) Measurement of the birefringence intensity of control injected (Ctrl-MO1/-MO2 and Ctrl-gRNA) and smyd1a deficient (MO1-/MO2-smyd1a and smyd1a-gRNA) embryos. Signal intensities of n=10 embryos were normalized against the mean of the respective control measurement. Data are shown as mean value (box = 25th and 75th percentile; error bars = min/max).Statistical analysis of three independent experiments was performed using one-way ANOVA followed by tukey’s multiple comparison analysis (**** p<0.0001). (B) Myosin specific whole mount immunofluorescence stainings of control morpholino (Ctrl-MO1) injected embryos and MO1-smyd1a morphants in comparison to homozygous fla mutants which lack Smyd1b expression. In contrast to a decreased myosin protein level in fla mutants, structural disorganization of myofibers is observed in smyd1a deficient morphants. (C) Schematic overview of the misfolded myosin response (MMR) after Etard et al. (2015).