
Image
|
Figure Caption
Fig. 2-S1
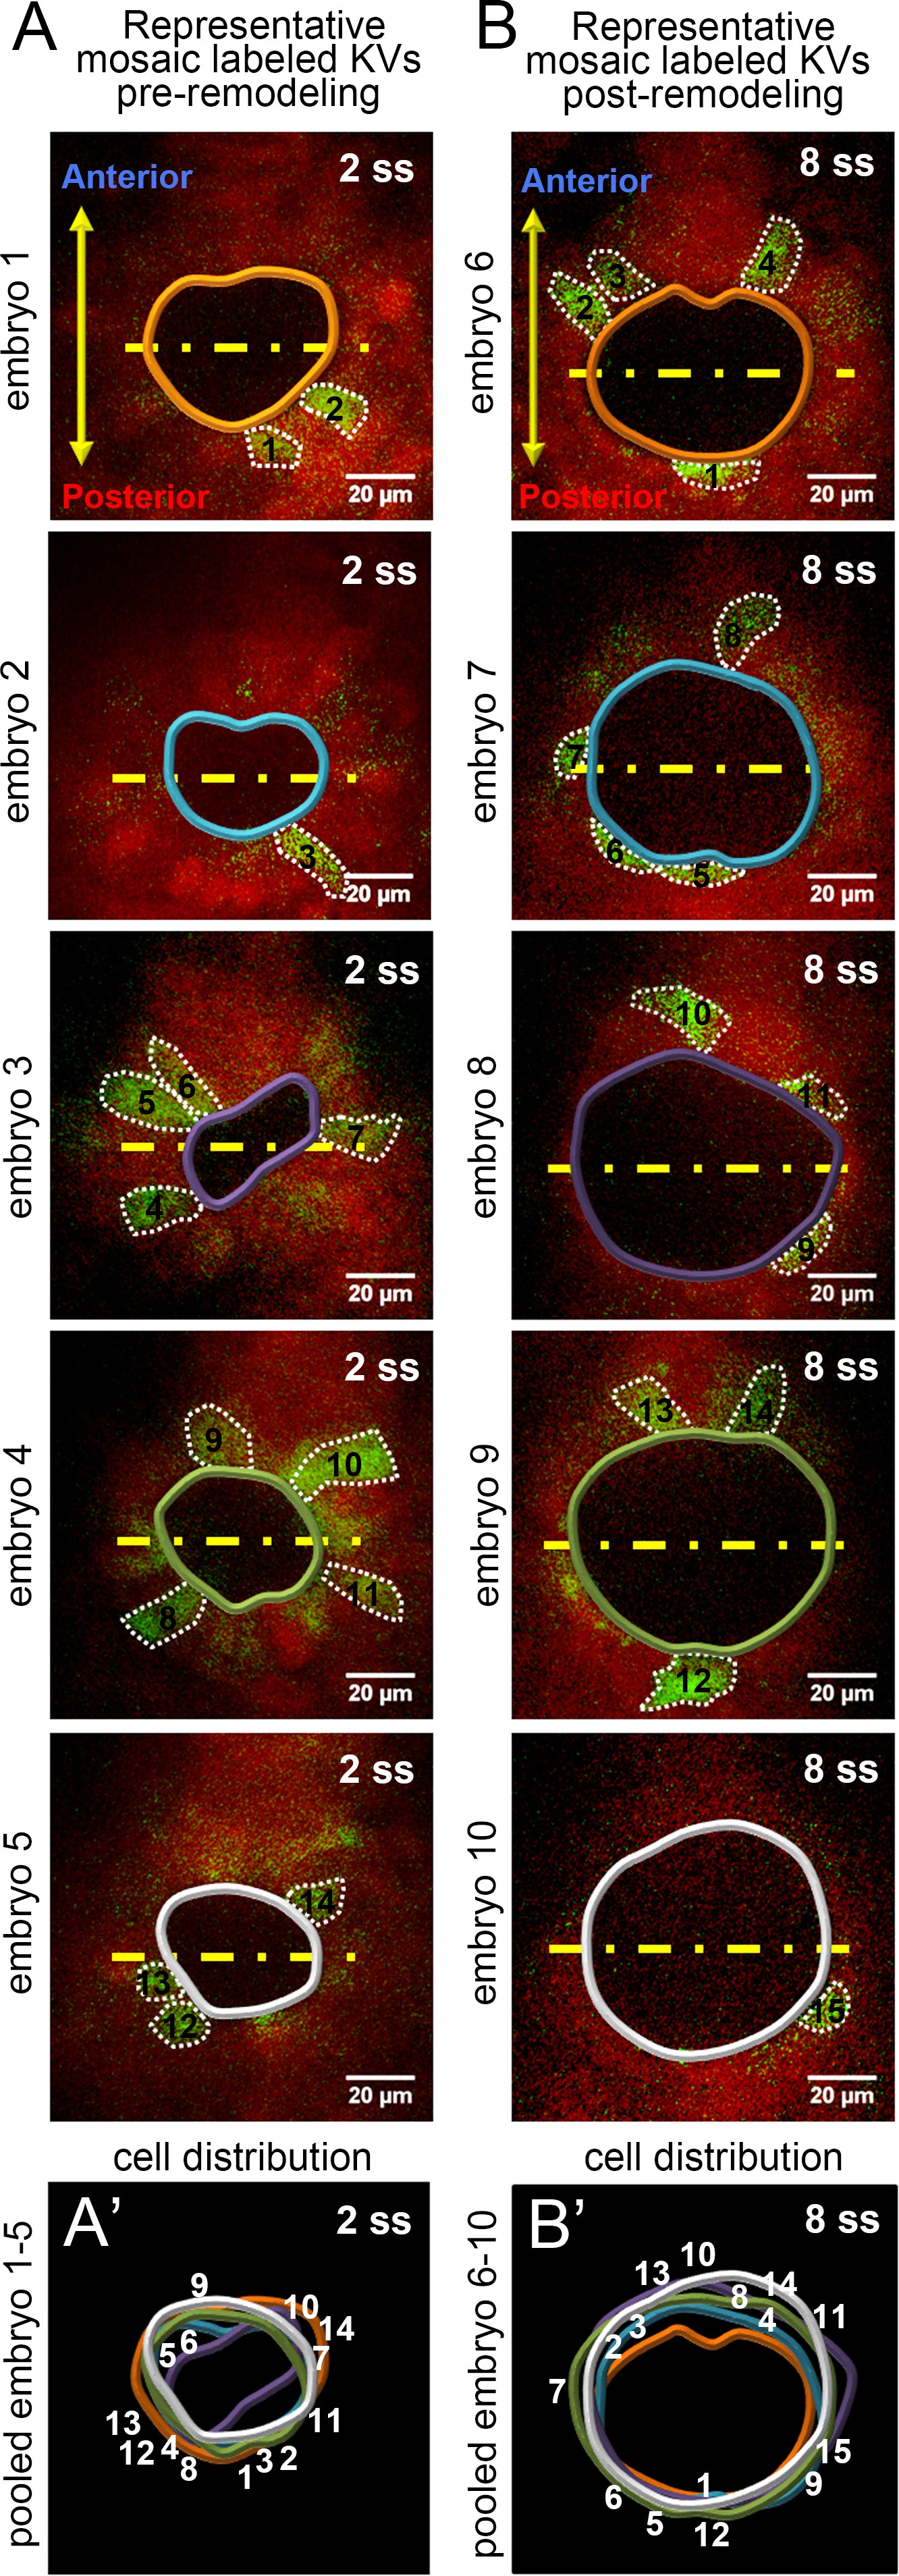
Single KV cells were sampled from all positions along the middle plane of KV for morphometric analysis.
(A,B) Representative mosaic labeled KVs at pre (2 ss) and post-remodeling (8 ss) stages. YFP+ cells along the middle plane of the organ are numbered. KV lumen and cell boundaries are outlined. Yellow lines divide the KV lumen into anterior and posterior halves. (A’,B’) Pooled images of KV lumen boundaries and cell numbers show no bias in the distribution of mosaic labeled cells. Scale = 20 μm.
Acknowledgments
This image is the copyrighted work of the attributed author or publisher, and
ZFIN has permission only to display this image to its users.
Additional permissions should be obtained from the applicable author or publisher of the image.
Full text @ Elife