
|
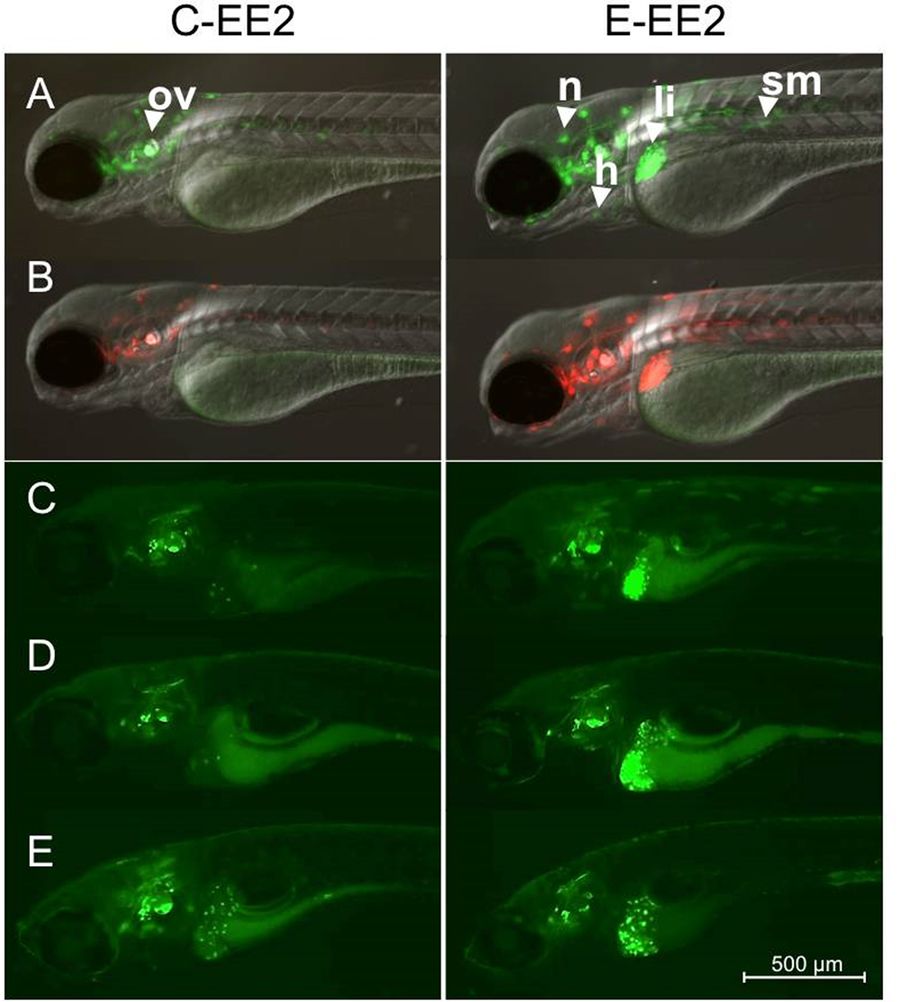
Fig. 5
Sensitivity to ethinylestradiol for repeated exposures. Control (non-exposed) larvae and larvae exposed initially to 10 ng EE2/L over the period of 48 h (0–2 dpf) were imaged at 3 dpf (A) and the Kaede response was then converted fully from green to red fluorescence via UV exposure (B). Both groups of photoconverted larvae (control and EE2-exposed) were then exposed to 10 ng EE2/L over the period 3–5 dpf (C), 5–7 dpf (D) or 9–11 dpf (E) and imaged on the final day of exposure (n = 18). Newly generated Kaede expression (green fluorescence) in liver, heart and somite muscle green was quantified by image analysis. All images were acquired by inverted compound microscope using a 5× objective. (A) and (B) images were acquired using GFP, RFP and DIC filters. (C), (D), and (E) are presented with the GFP filter only. Specific tissue response in the liver (li), heart (h), somite muscle (sm), otic vesicle (ov) and neuromast (n).