
|
Fig. S3
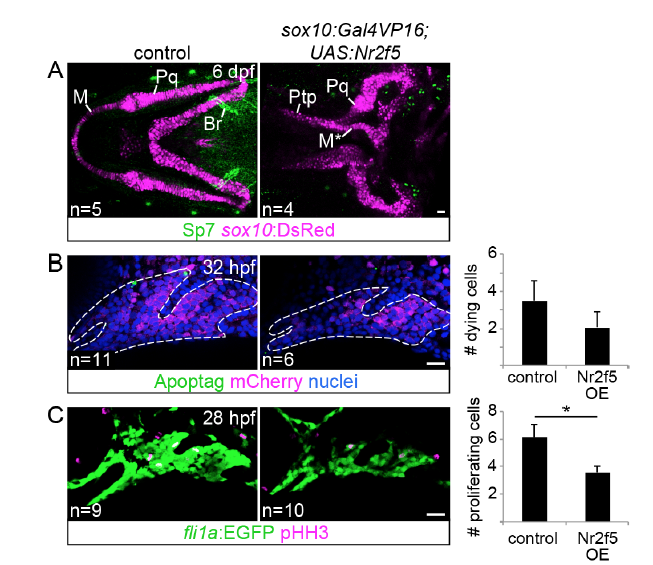
Analysis of osteoblast differentiation, cell death, and proliferation in nr2f5 misexpression embryos. (A) The sox10:DsRed transgene (magenta) and Sp7 antibody (green) label chondrocytes and osteoblasts, respectively. Note the strong Sp7 staining in the second arch-derived branchiostegal ray bone (Br). No ectopic Sp7 staining was detected in the vicinity of the transformed Meckel’s (M) cartilage. Pq, palatoquadrate; Ptp, pterygoid process (out of view in control image). (B) Similar numbers of apoptotic cells (green) were seen in the first two arches of control and sox10:Gal4VP16; UAS:nr2f5 transgenic embryos (nr2f5 OE) at 32 hpf (Mann Whitney U, p > 0.05). Arch NCCs express sox10:DsRed (mCherry antibody staining, magenta), and nuclei were labeled with Hoechst (blue). Dashed lines indicate arch boundaries. (C) nr2f5-misexpressing embryos showed a marginally significant decrease in the number of dividing cells (pHH3+, magenta) in the first two arches relative to controls (Mann Whitney U, p < 0.05). Arch NCCs express fli1a:EGFP (GFP antibody staining, green). The number of embryos evaluated for each genotype is indicated at the bottom left. Scale bars = 20 μm.
Reprinted from Developmental Cell, 44(3), Barske, L., Rataud, P., Behizad, K., Del Rio, L., Cox, S.G., Crump, J.G., Essential Role of Nr2f Nuclear Receptors in Patterning the Vertebrate Upper Jaw, 337-347.e5, Copyright (2018) with permission from Elsevier. Full text @ Dev. Cell