
|
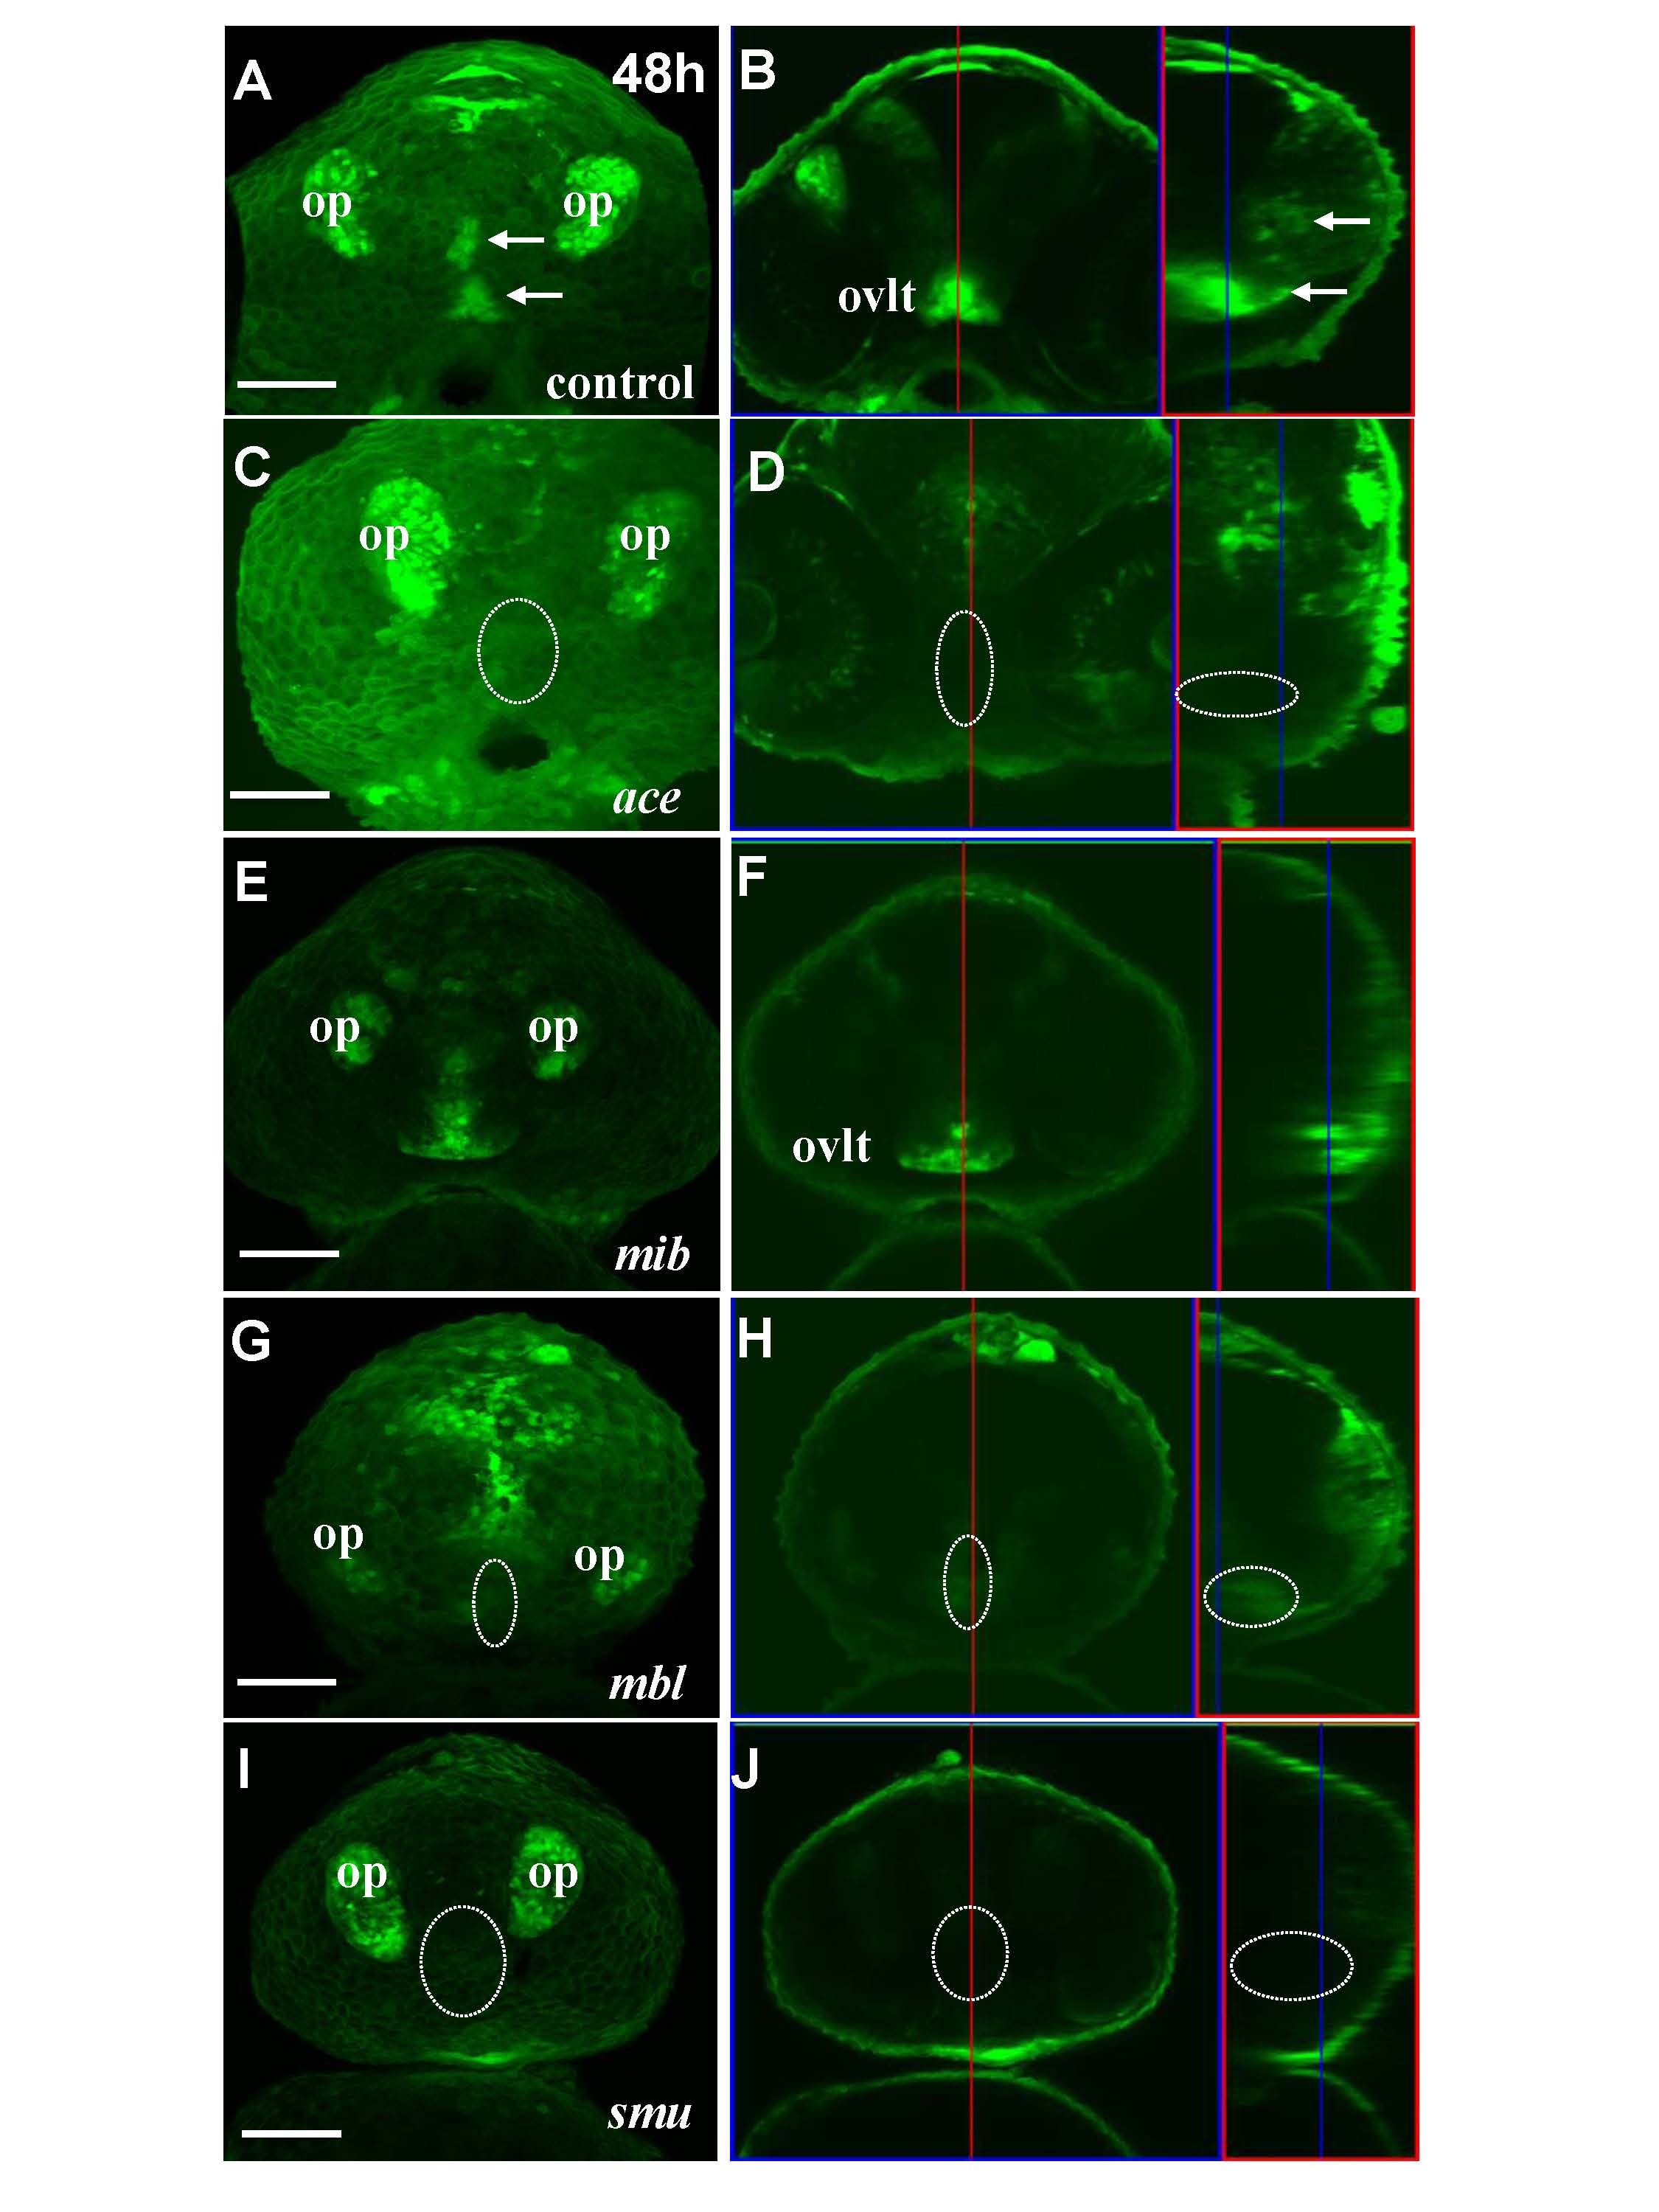
Fig. S1
Mutant analysis of development of the OVLT and SFO at 48 hpf. (A,B) Frontal view and confocal cross-section of control embryo. Strong GFP expression maps the OVLT-SFO complex, which clearly separates into two parts–dorsal and ventral (white arrows). (C,D) Frontal view and confocal cross-section of ace−/− mutant embryo. The GFP expression domain corresponding to the OVLT/SFO complex not detected (highlighted with circle). (E,F) Ventral view and confocal section of the mib−/− mutant. The dorsal part of this complex is missing. (G,H) Ventral view and confocal section of MBL mutant, respectively. Absent of expression at region of OVLT (highlighted with circle). (I,J) Ventral view and confocal section of SMU mutant, respectively. Absence of OVLT domain at 48 hpf (highlighted with circle). For confocal sections, the left part represents the optical cross section and right part-saggital section. Red line through cross section indicates where saggital section is. Blue line through saggital section indicates, where cross-section is. All images are taken with 25x magnification with no zoom except mib and smu mutants, which is taken with 10x magnification with 2x zoom. Abbreviations: op, olfactory pits; ovlt, organum vasculosum of lamina terminalis. Scale bar−50 μm.