
|
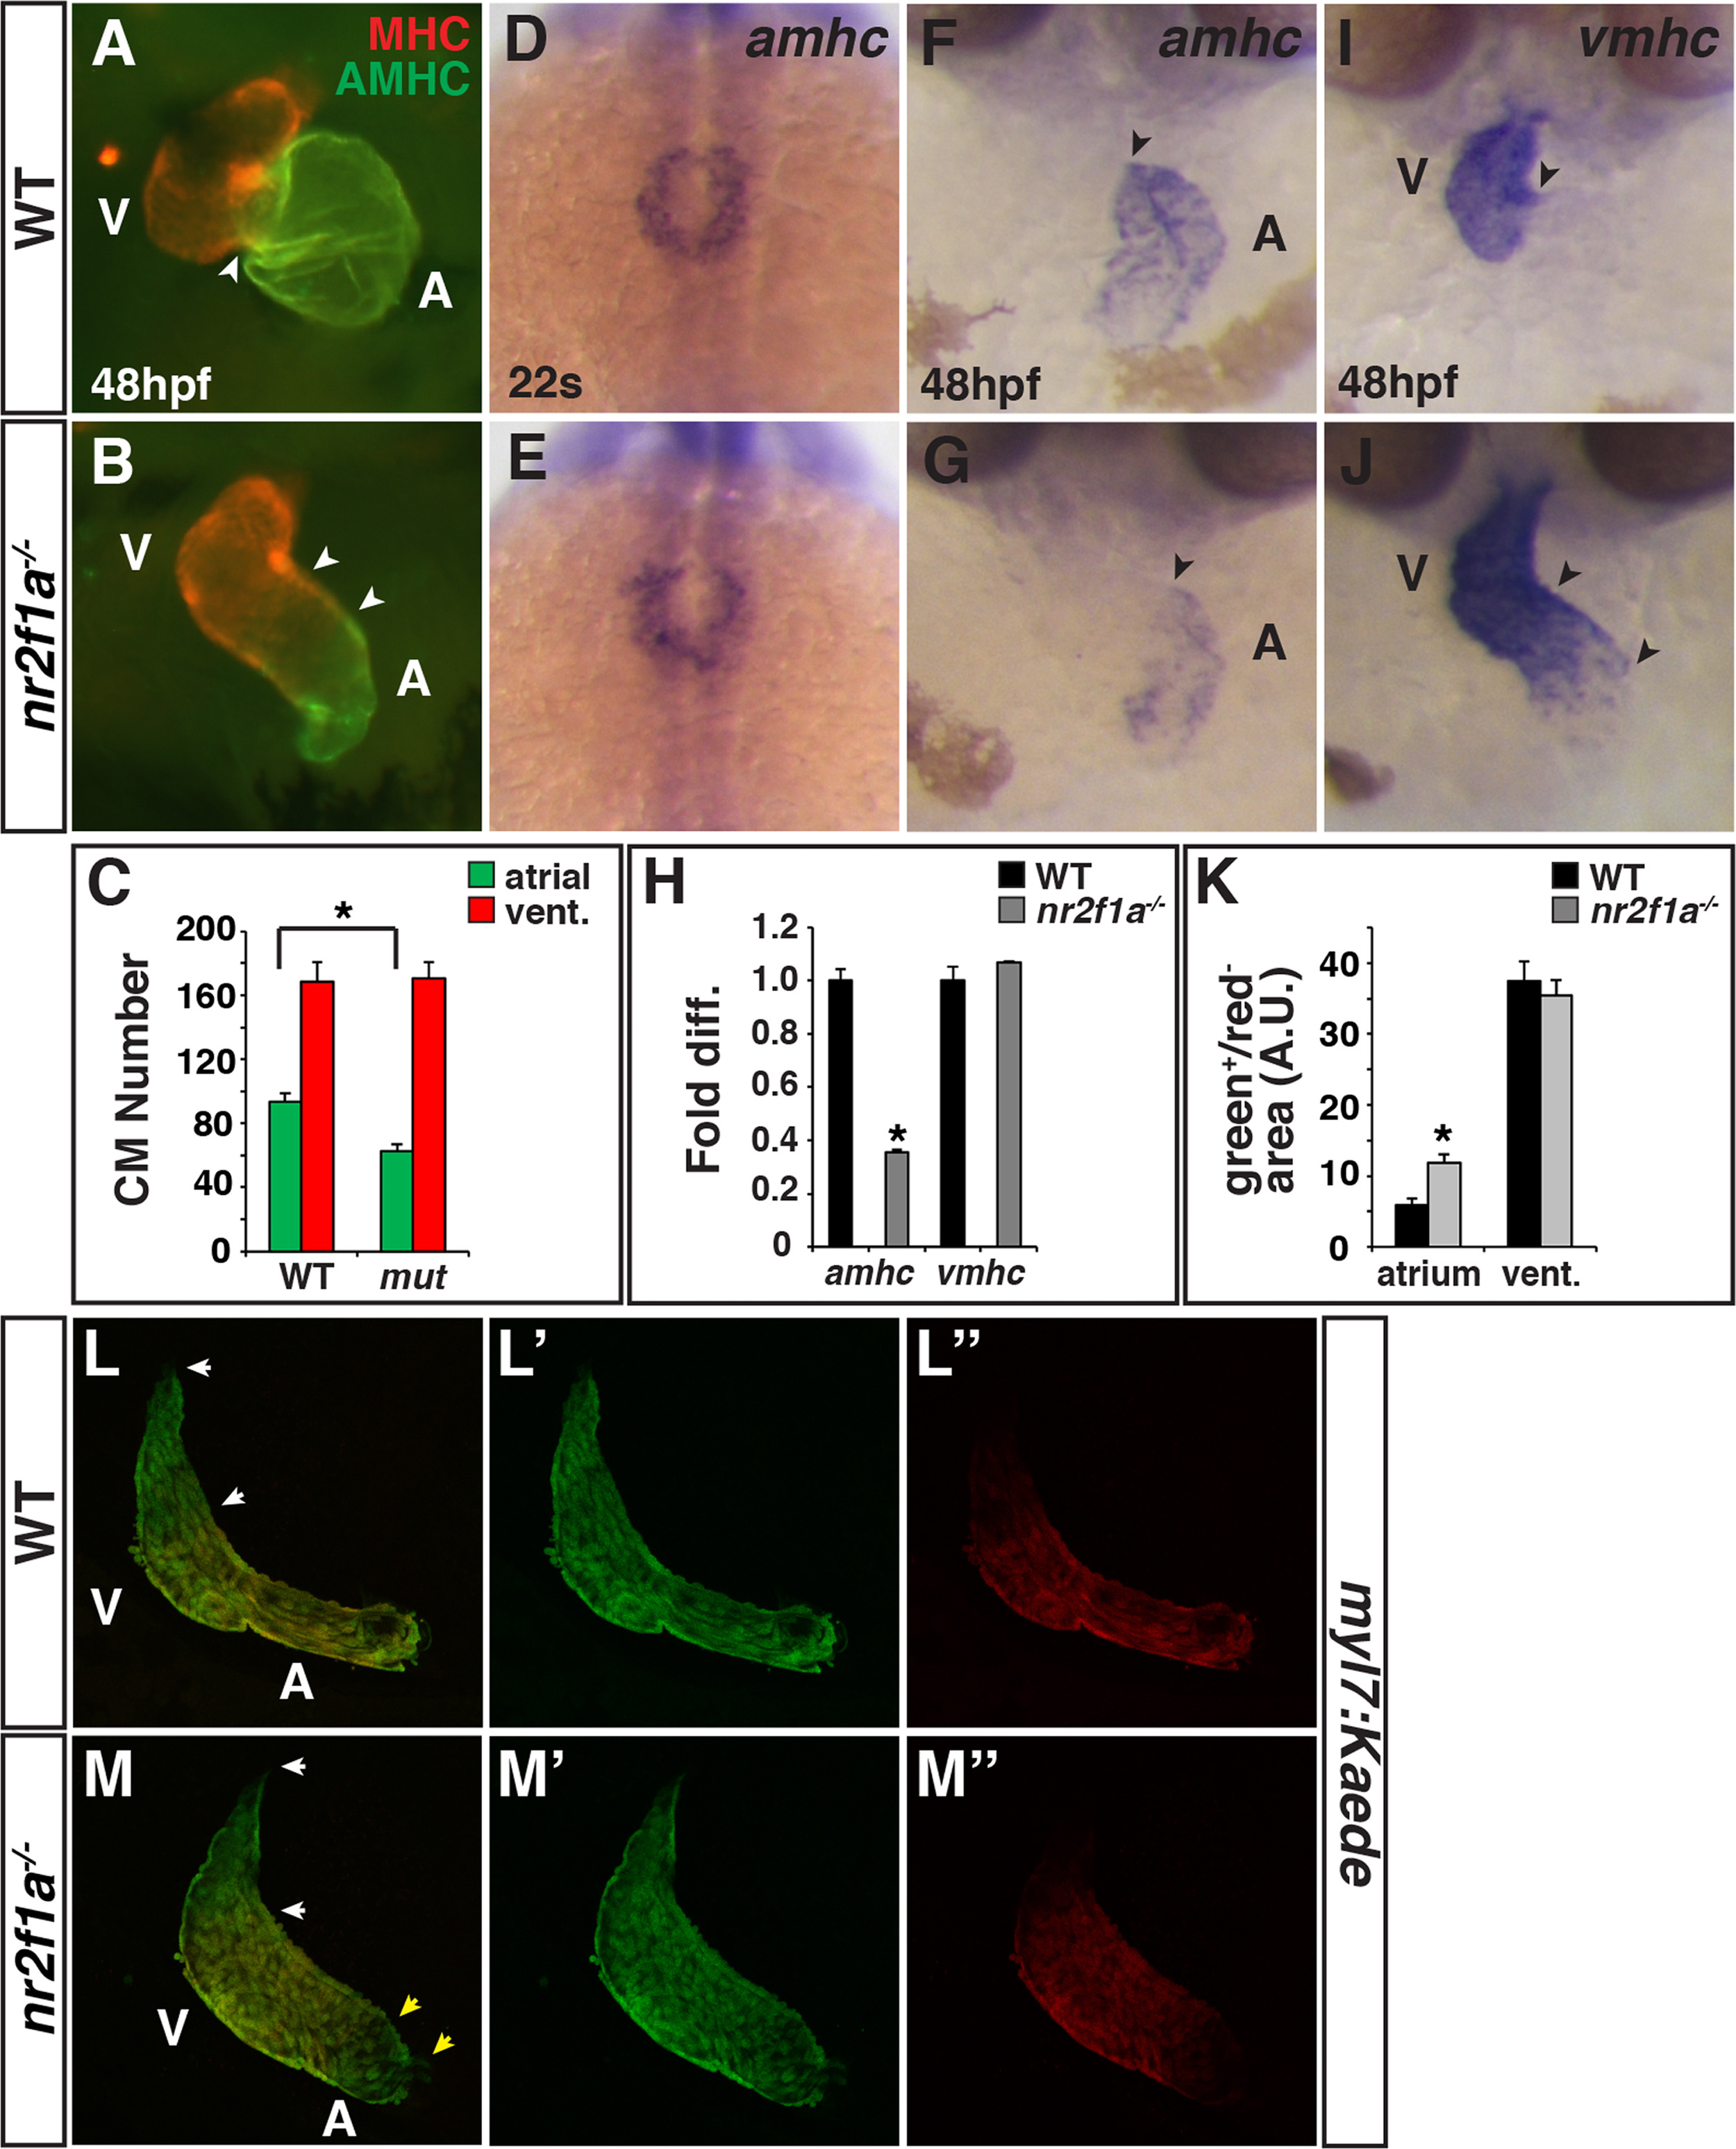
Fig. 2
Nr2f1amutants have smaller atria. (A,B) IHC for MHC (red) and AMHC (green). Sharp border between MHC and AMHC in WT embryos (arrowhead in A). Diffuse border of AMHC expression (arrowheads in B). (C) Number of ACs and VCs in WT sibling (n = 12) and nr2f1a mutant (n = 14) embryos. (D,E) ISH for amhc at the 22 s stage. Images are dorsal views with anterior up. (F,G) ISH for amhc at 48 hpf. Border of expression (arrowheads). (H) RT-qPCR for amhc and vmhc in WT sibling and nr2f1a mutant embryos. (I,J) ISH for vmhc at 48 hpf. Distinct border of expression (arrowhead in I). Expansion and diffuse border of expression (arrowheads in J). Images in F,G,I,J are frontal views.>20 embryos per condition were examined for A,B,D,E,F,G,I,J. (K) Amount of green+/red- cells (area) at the venous (atrium) and arterial (ventricular) poles in WT and nr2f1a mutant embryos. (L-M″) Confocal images of hearts depicting the addition of differentiating cells (green+/red- cells) at the venous and arterial poles (yellow and white arrowheads, respectively). Asterisks indicates significant difference (P<0.05) in all figures.
Reprinted from Developmental Biology, 434(1), Duong, T.B., Ravisankar, P., Song, Y.C., Gafranek, J.T., Rydeen, A.B., Dohn, T.E., Barske, L.A., Crump, J.G., Waxman, J.S., Nr2f1a balances atrial chamber and atrioventricular canal size via BMP signaling-independent and -dependent mechanisms, 7-14, Copyright (2017) with permission from Elsevier. Full text @ Dev. Biol.