
|
Fig. 1
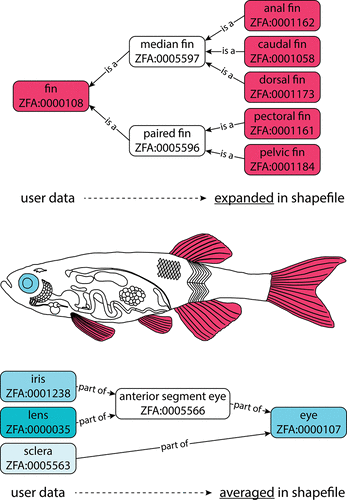
ZFA anatomical ontology are used to map scalar expression data to defined anatomical regions. This also provides a means to directly and visually compare data from different experiments and heterogeneous data sets. In this example, the user has provided data for “fin”, which is then propagated to the five distinct fins visualized in the tool, through the parent–child (is a) relationships defined in ZFA. Because the fins are not distinguished in the user’s data set, the expression value provided by the user is mapped to all five visible fins. If the user provides information on a more detailed level than is visualized by COMICS, then the mean expression of all children or parts is mapped to the anatomical structure defined in the shapefile. Here separate expression data for the iris, sclera, and lens (all part of the eye) are averaged to the eye. The averaging is done once, for all parts, independent of intermediate levels in the ontological hierarchy (such as the anterior segment eye). The default shapefile corresponds to the organs and tissues that are easy to dissect for an omics experiment, although the shapefile can easily be modified to incorporate other experimental designs.