
Image
|
Figure Caption
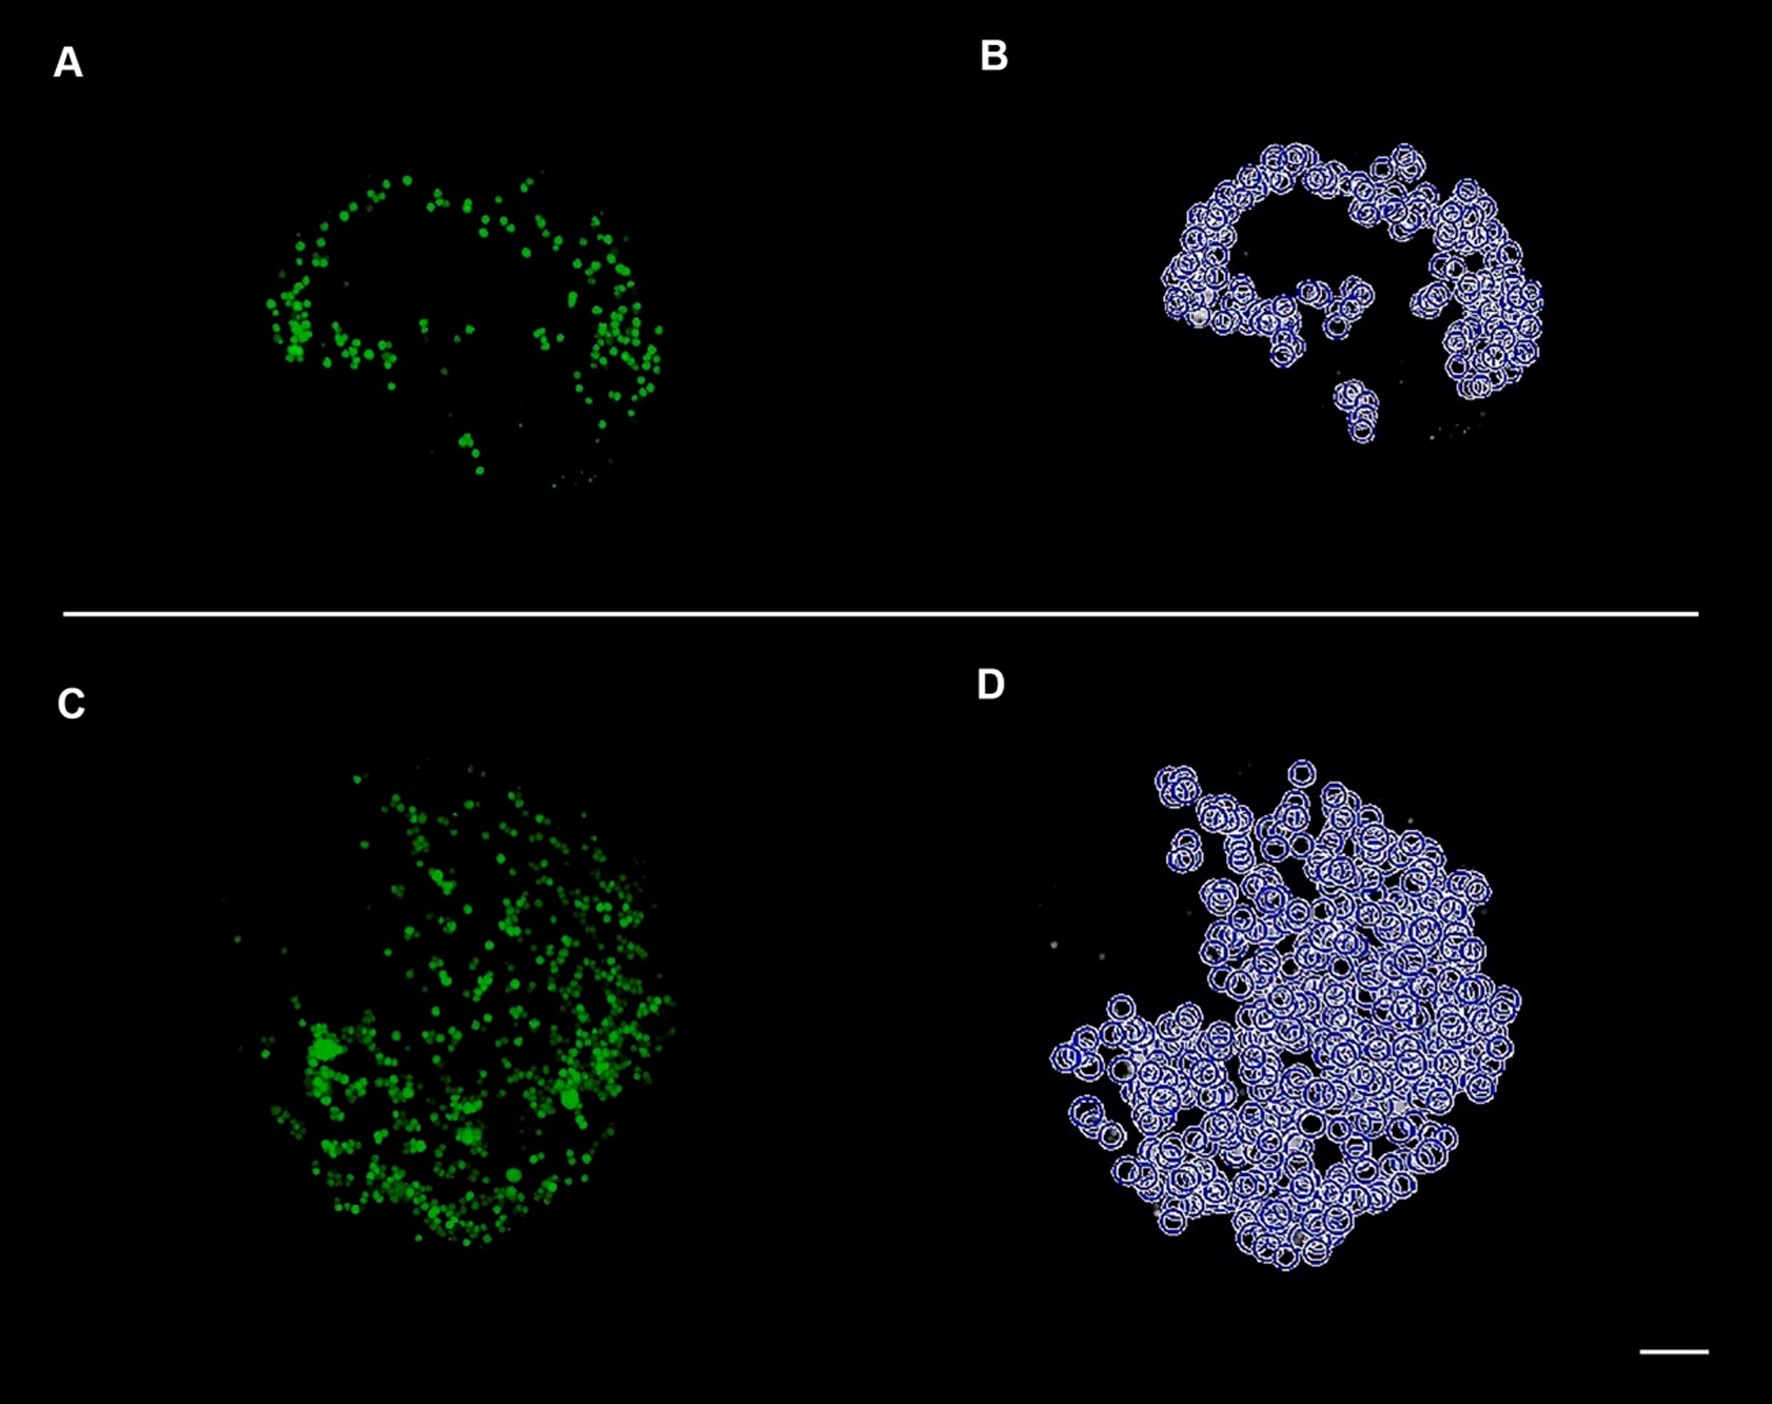
Fig. S2
Automated counting of cells. This image shows the process of the software to count the cells on the microscope slide performed before the injection of the zebrafish embryos. (A) Fluorescent image of low cell number. (B) Cells of the A image counted (179). (C) Fluorescent image of high cell number. D: Cells of the C counted (404). Scale bar = 100 μm.
Acknowledgments
This image is the copyrighted work of the attributed author or publisher, and
ZFIN has permission only to display this image to its users.
Additional permissions should be obtained from the applicable author or publisher of the image.
Full text @ BMC Cancer