
|
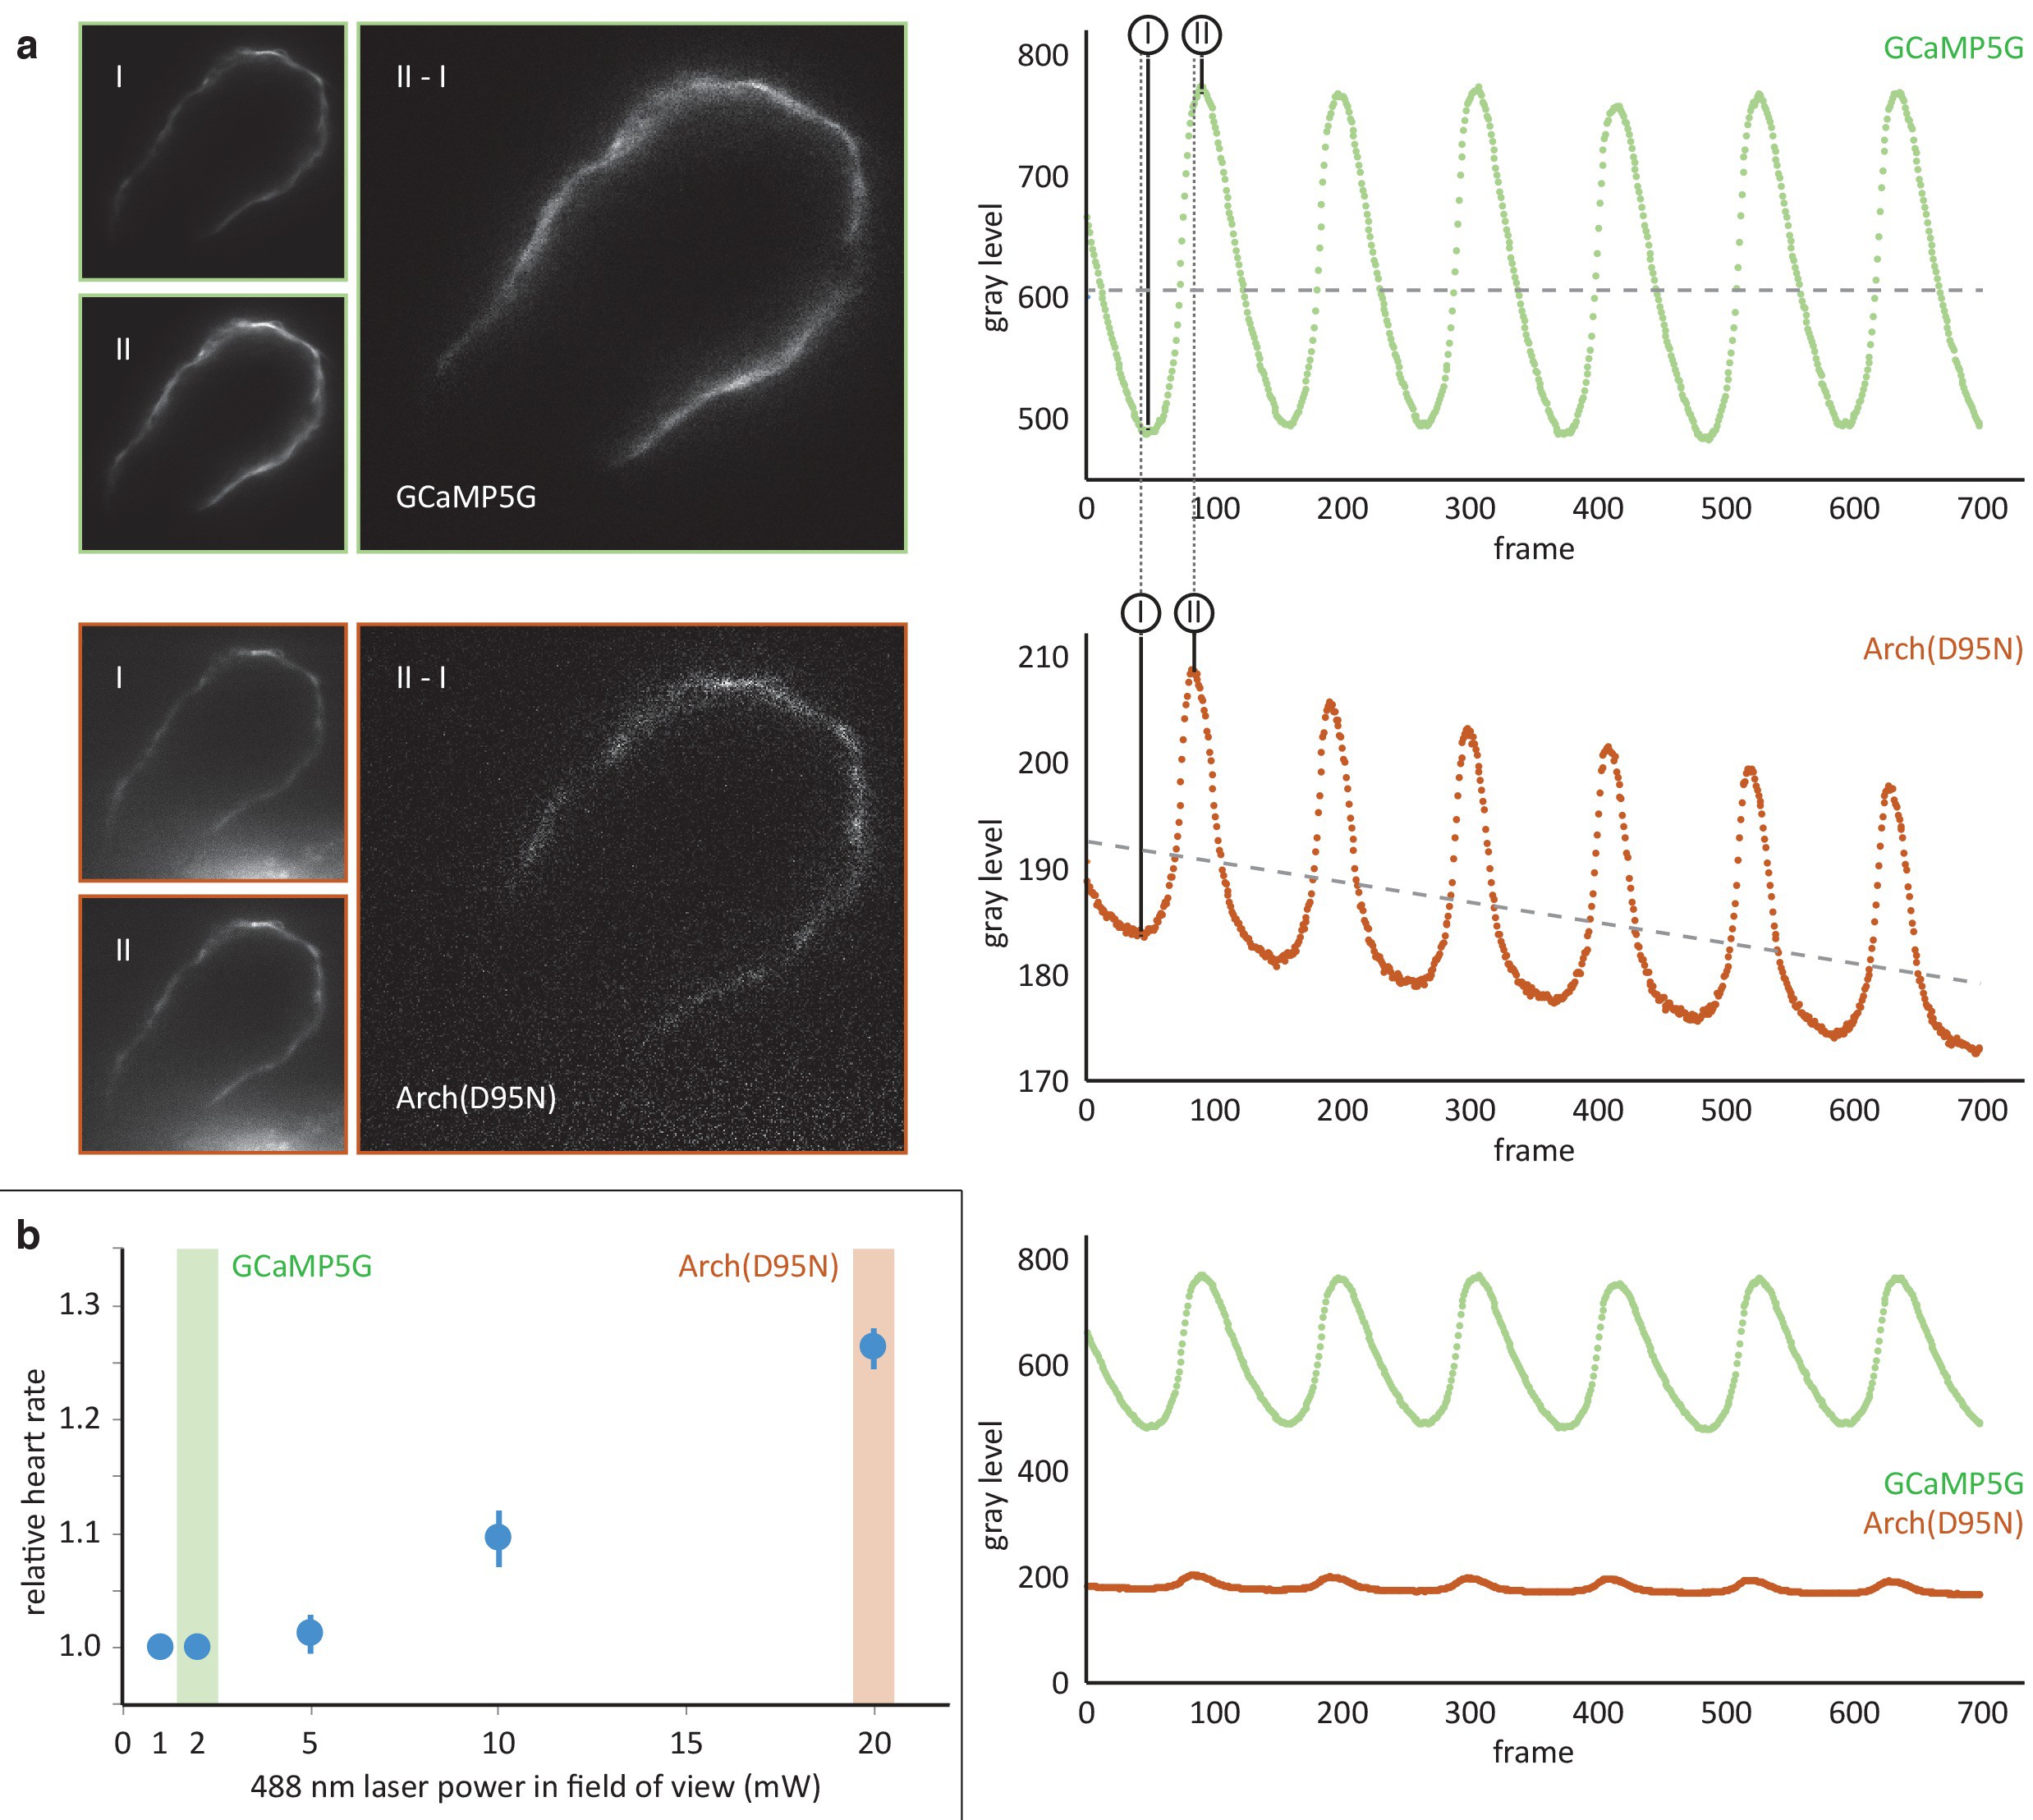
Fig. 1-S2
Comparison of the calcium reporter GCaMP5G and the voltage reporter Arch(D95N) for multi-scale readout of cardiomyocyte activation.
(a) Optical section across the atrium of a zebrafish embryo at 52 hpf expressing GCaMP5G and Arch(D95N) in cardiomyocytes. Both channels are recorded simultaneously. Smaller images: raw data recorded at the lowest (I) and highest (II) fluorescence signal, as indicated in the intensity plots. Note how intensity plots illustrate the known slight delay between intensity maxima of calcium versus voltage traces, and the overall excellent capture by both reporters of presence and temporal dynamics of cell activation. Larger images: results of image I subtracted from image II, presenting the maximum intensity difference (image brightness adjusted independently for better visibility). Plots show mean raw intensities over time measured along the myocardium visible in the images. (b) Laser powers in the field of view (measured at the back pupil of the illumination objective) used for the experiment presented in (a) and their impact on the heart rate (n = 3 zebrafish embryos). Arch(D95N) required 10x more laser power than GCaMP5G, yielded a very low signal with about 20 gray levels dynamic range across one cardiac cycle, and was affected by bleaching. Zebrafish embryos showed increased heart rate when illuminated with the high laser power needed for Arch(D95N) imaging. GCaMP5G showed a dynamic range of about 300 gray levels at an order of magnitude lower laser power, with no signs of visible photobleaching or illumination-induced increase in heart rate.