
Image
|
Figure Caption
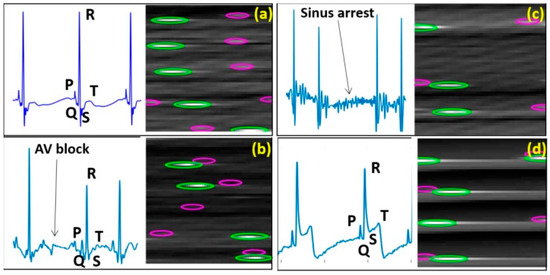
Fig. 8
Exemplary standard ECG patterns and exemplary conversion images for CNN training to indicate general differences in the presentation of wave morphology. (a) Control fish; (b–d) Mutant lines with phenotypes of AVB, SA and STE, respectively. Green: R peaks; Pink: P peaks.
Acknowledgments
This image is the copyrighted work of the attributed author or publisher, and
ZFIN has permission only to display this image to its users.
Additional permissions should be obtained from the applicable author or publisher of the image.
Full text @ Sensors (Basel)