
|
Fig. S4
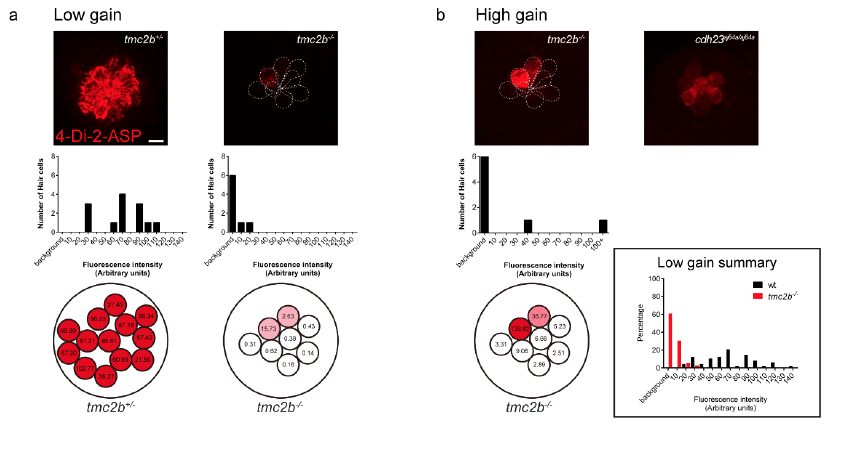
Variation of 4-Di-2-ASP uptake in hair cells within a single posterior neuromast of a tmc2b-/- mutant. (a and b) Micrographs of L1 neuromast hair cells exposed to 4-Di-2-ASP (top), histograms of individual hair cell uptake (middle), and quantitative maps of hair cell uptake (bottom) under low gain (a) and high gain (b). Scale bar = 6 μm. (a) Every posterior neuromast hair cell in tmc2b+/- larvae take up 4-Di-2-ASP, ranging from 30-110 fluorescence intensity units. In mutants, under low gain, hair cell fluorescence intensity values are negligible (<1 unit) for six cells and very low (1-20 units) for two cells. Background is defined as 0-1 unit. (b) Under high gain, 6 cells from a tmc2b-/- animal had negligible (<10 units) fluorescence intensities; however, two had increased intensities. In contrast, all hair cells of the cdh23aj64a/aj64a posterior neuromasts take up 4-Di-2-ASP. (Inset) Summary, percentages of hair cells at different fluorescence intensity units under low gain (n = 5).