
|
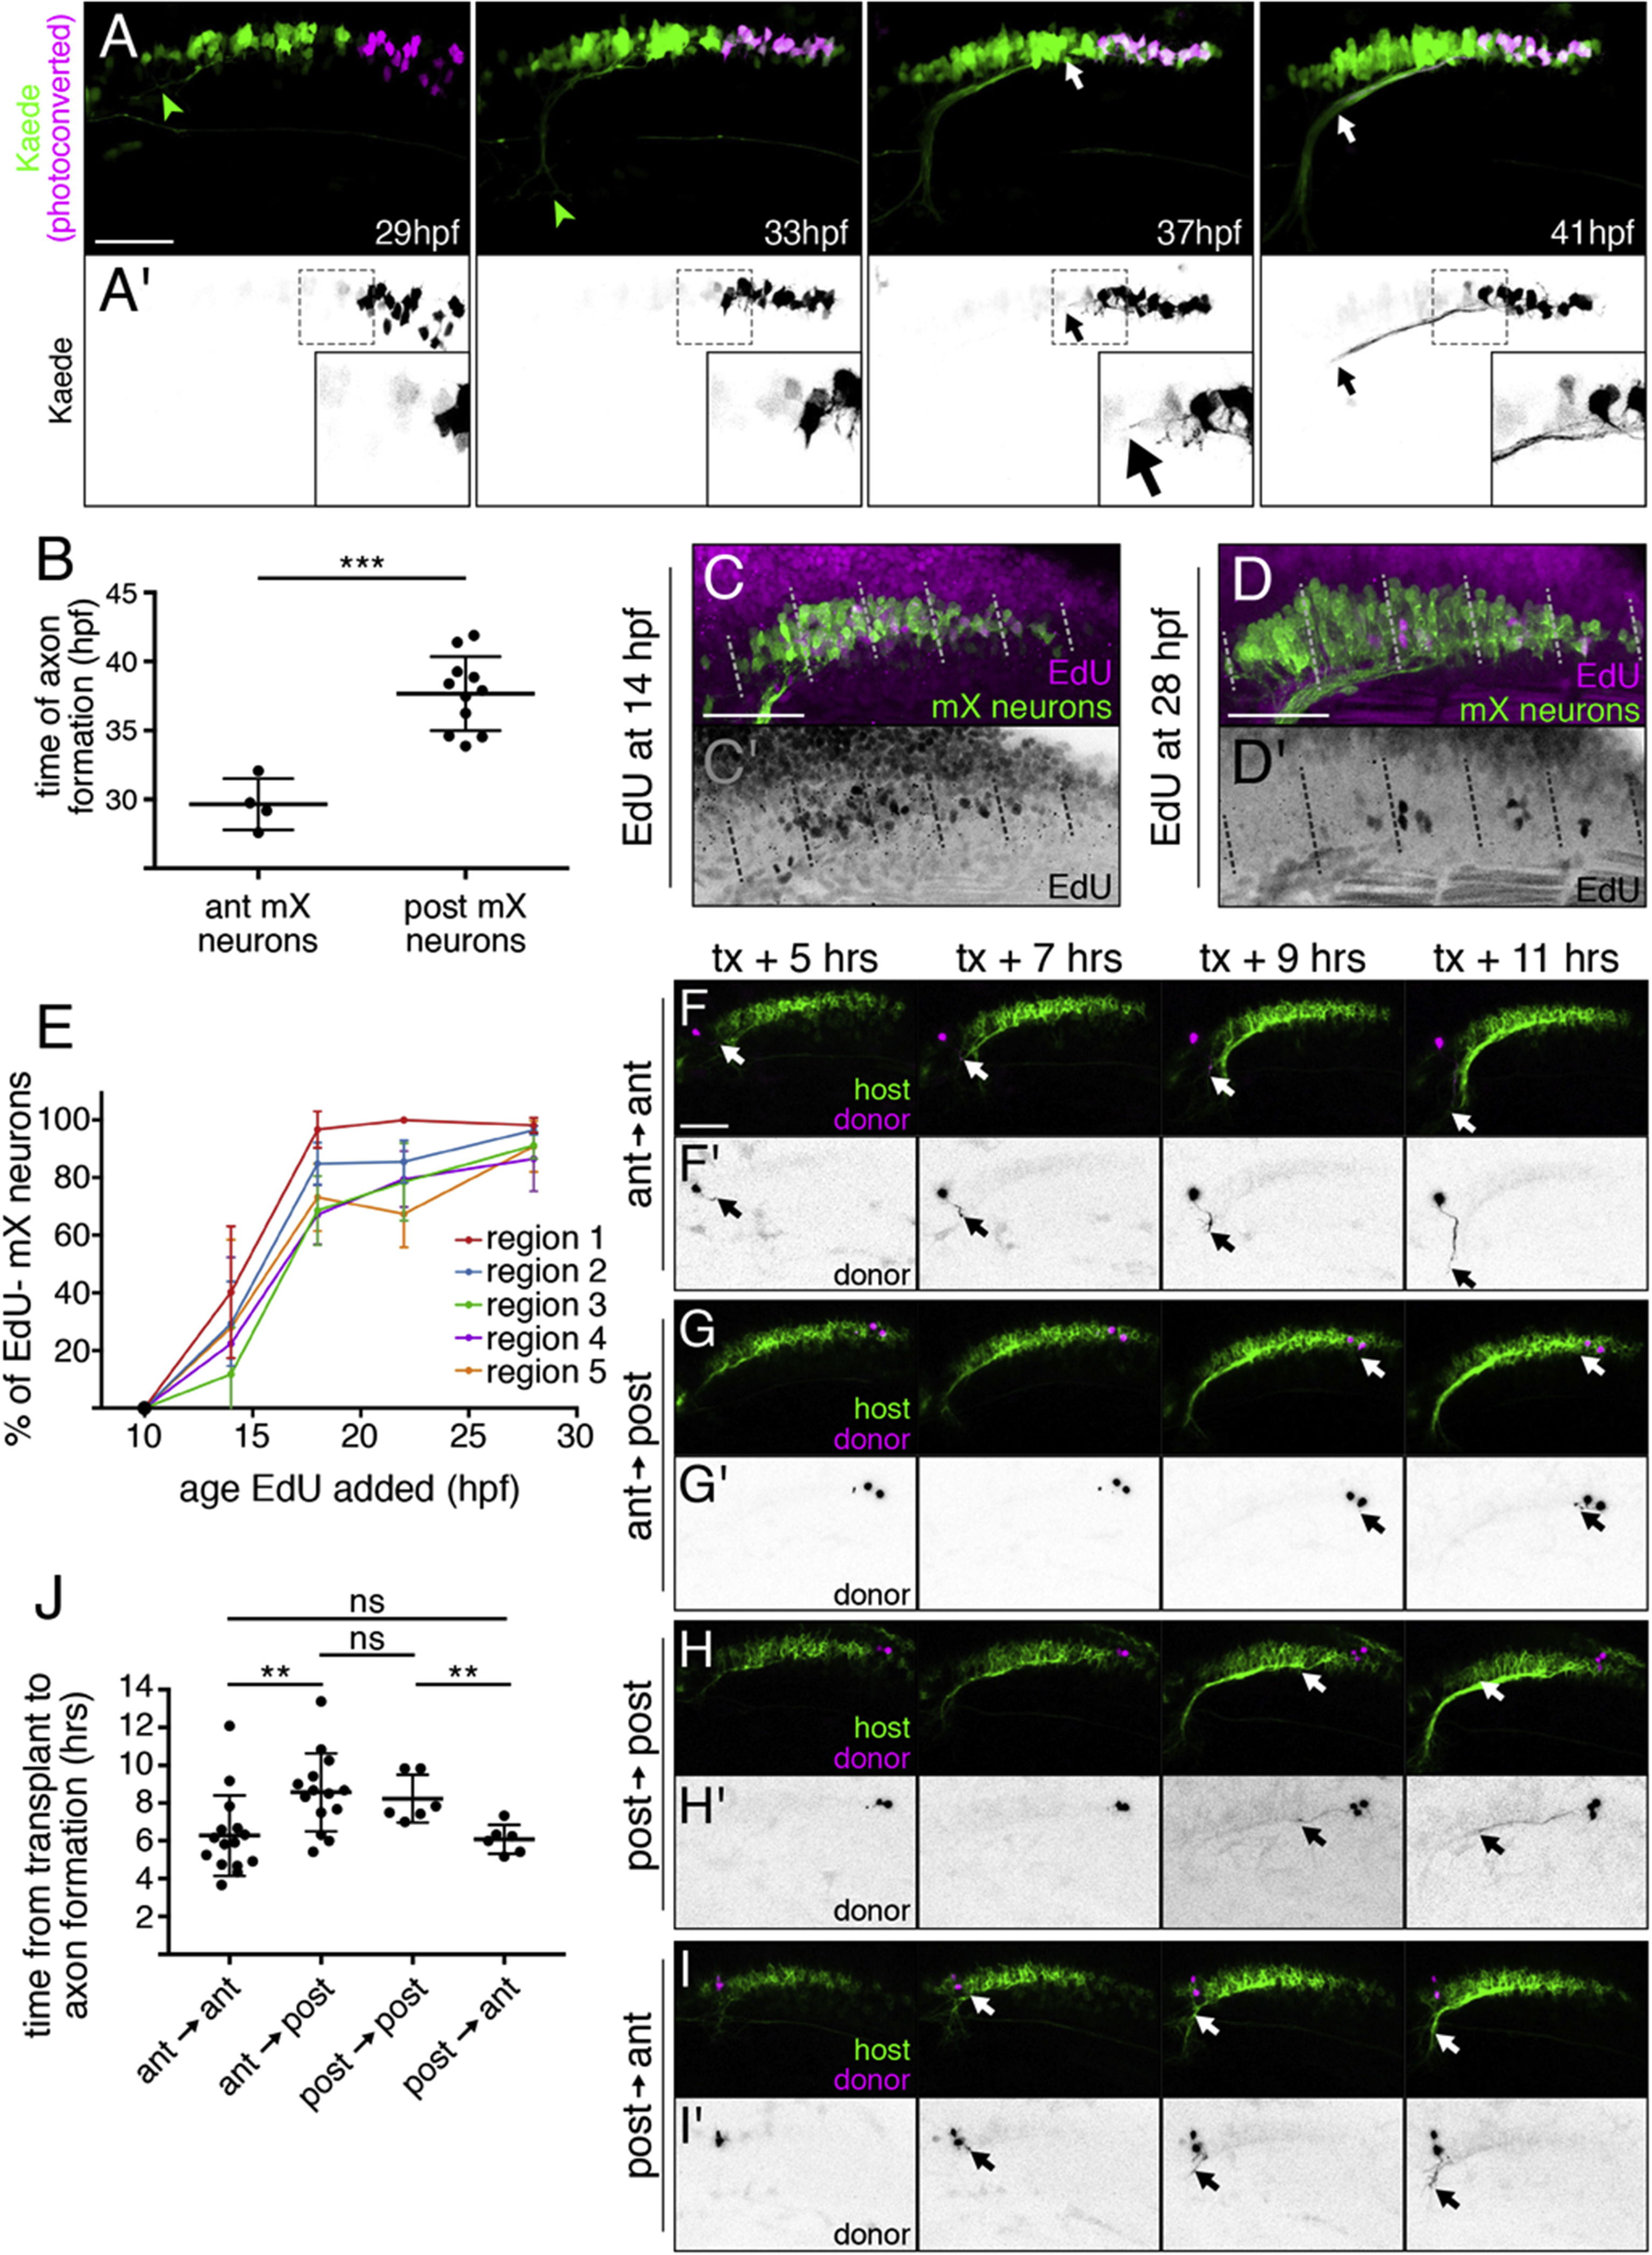
Fig. 5
Time of Axon Formation and Arrival in the Head Periphery Is Delayed in Posterior mX Neurons Independent of Birthdate
(A) Stills from representative time lapse (see Movie S3) of embryo expressing Tg(isl1:Gal4);Tg(UAS:Kaede). Photoconverted posterior mX neurons (magenta, A; black, A′; white arrow) initiate axons 8 hr after anterior mX neurons (green, green arrowhead).
(B) Quantification of (A). Each point represents a single embryo. Analysis was done by unpaired t test.
(C and D) Embryo expressing Tg(isl1:GFP) (green) was incubated in EdU (magenta; C′ and D′, black) to label cells born after 14 hpf (C) or 28 hpf (D). Embryos were fixed at 48 hpf, and the mX territory was divided into 5 equal-length regions from anterior (1) to posterior (5).
(E) Quantification of (C and D) showing percentage of postmitotic (EdU−) mX neurons (isl1:GFP+) in each region at each time point ([no. EdU−GFP+ cells]/[no. GFP+ cells]). Each point represents mean; error bars show SD. n = 5 embryos for all time points except 14 hpf, where n = 4 embryos.
(F–I) Transplanting an anterior mX neuron heterotopically into the posterior delays axon formation (F and G) whereas transplanting a posterior mX neuron into the anterior hastens axon formation (H and I). Donor neurons are marked by Tg(isl1:Kaede) in magenta and (F′–I′) black, and host neurons are marked by Tg(isl1:mRFP) in green. See also Movies S4 and S5.
(J) Quantification of (F)–(I). Each point represents a single embryo. Analysis was done by unpaired t test.