
|
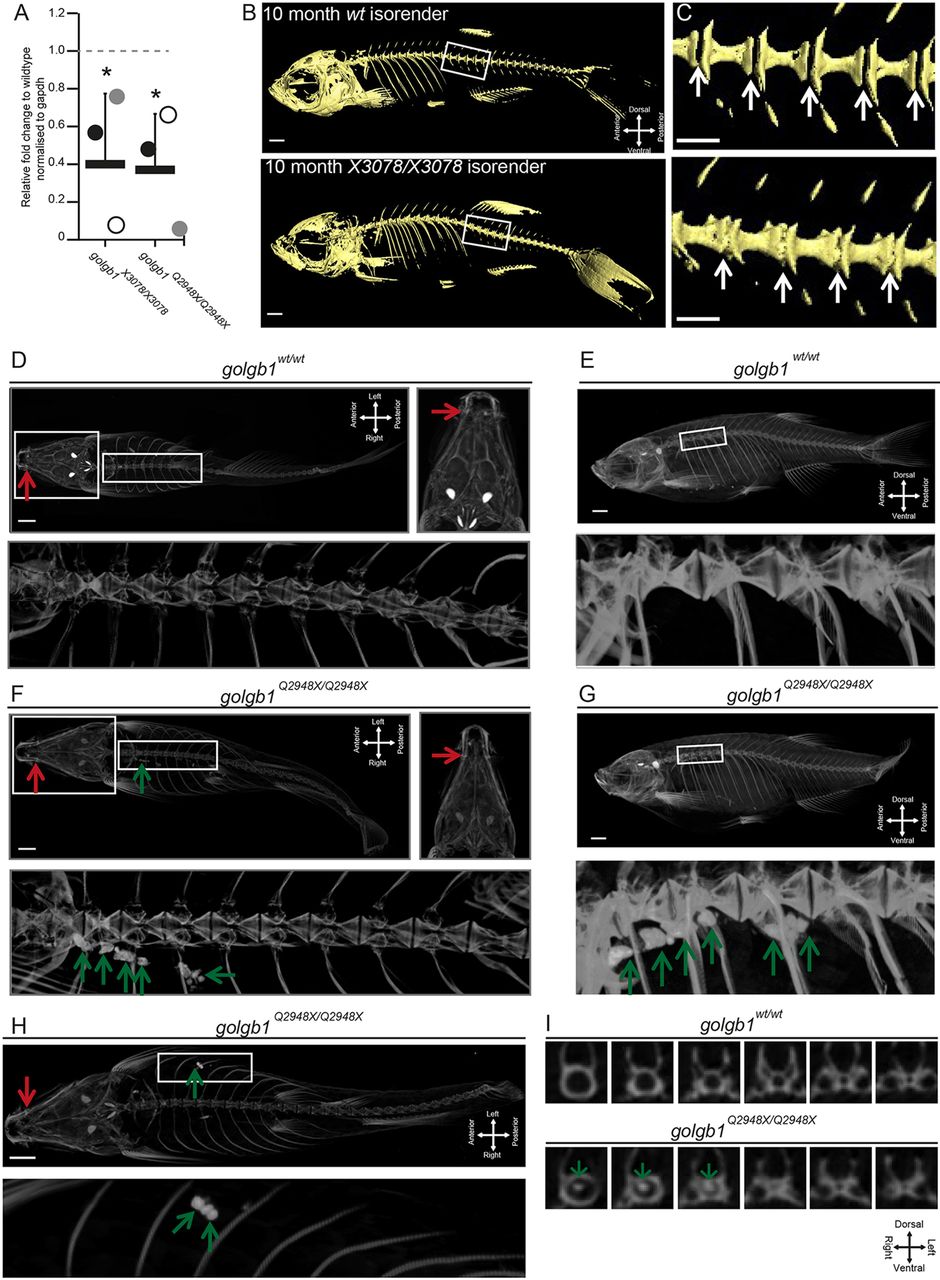
Fig. 5
Giantin-KO zebrafish have reduced galnt3 expression and exhibit HFTC-like phenotypes. (A) Real-time qPCR pair-wise analysis of galnt3 expression at 60–63 dpf in two golgb1 mutant zebrafish lines normalised to gapdh mRNA levels as housekeeping gene. Bars show mean expression for each mutant line (n=3 per genotype group) relative to WT siblings (WT expression 1 AU depicted by dashed line). Each circle represents one individual (*P≤0.05, mean with s.d.; unpaired t-test was used as data were normally distributed). (B) Lateral views of micro-CT scans of 10-month-old WT and golgb1X3078/X3078 homozygous mutants, presented as isosurface renders. Boxed regions show enlarged regions in C. (C) Enlarged regions of the spine; white arrows demarcate intervertebral discs (IVDs), which in WT are not mineralised but in the mutant, ectopic mineralisation is seen manifesting as vertebral fusions. (D) Ventral (with high-resolution inset) and (E) lateral view micro-CT images showing craniofacial and spinal elements of a representative WT sibling (Q2948X line, n=3 females). (F–I) Three golgb1Q2948X/Q2948X female individuals showing ectopic calcium deposits in soft tissues (F, ventral view with high-resolution inset; G, lateral view of individual 1; H, ventral view of individual 2) and in spinal column (I, digital axial z-slices of individual 3). In D–I, red arrows indicate mandible joint and green arrows, ectopic deposits. Line Q2948X were imaged at 8 months post fertilisation. Scale bars: 100 µm.